Cisco Tetration - Hands-On Lab
Module26: Security Visibility & Monitoring
In this module we will review key security visibility and monitoring features of Tetration such as the Security dashboard, Vulnerability dashboard, and others. We’ll also investigate configuration of Alert triggers and the multiple alert destinations that can be configured.
![]() Click here to view a video reviewing the Security and Vulnerability Dashboards.
Click here to view a video reviewing the Security and Vulnerability Dashboards.
Steps for this Module
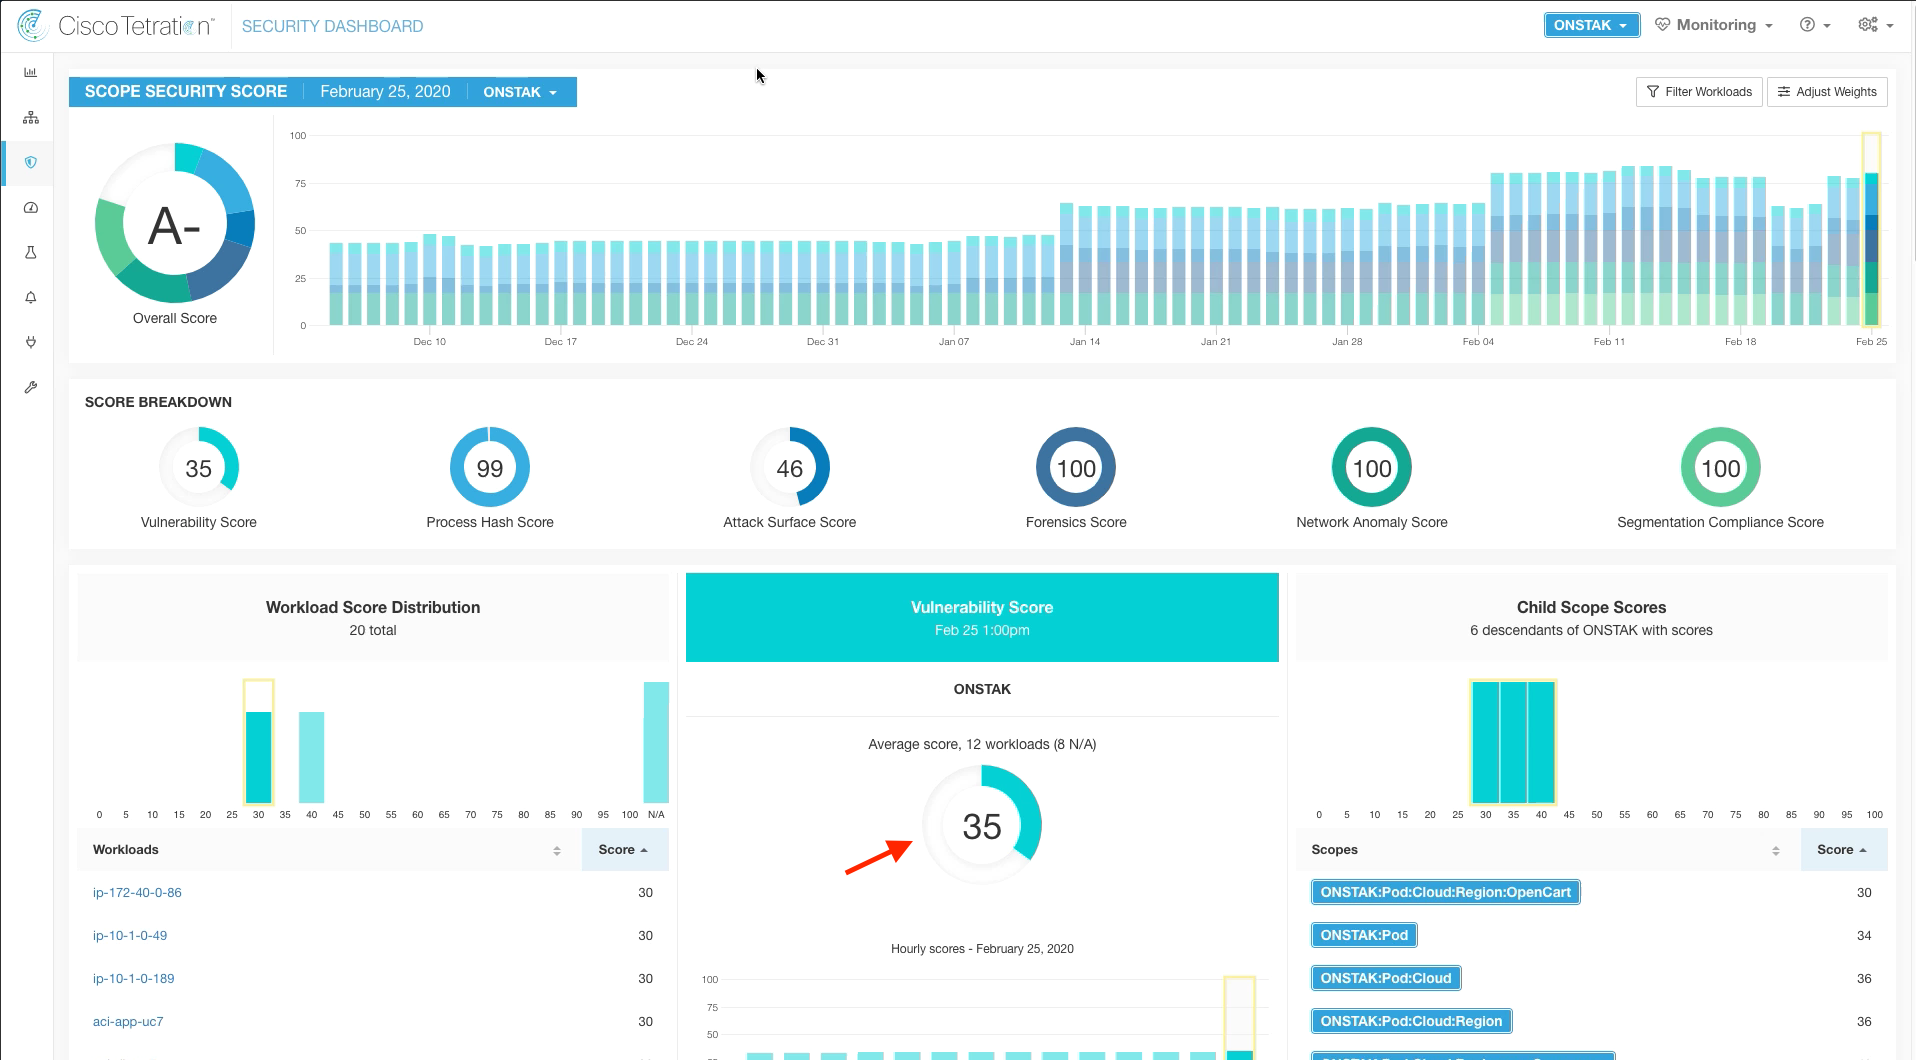
Step 001 - Examine Vulerability Score
Step 002 - Review Vulnerability Score Help
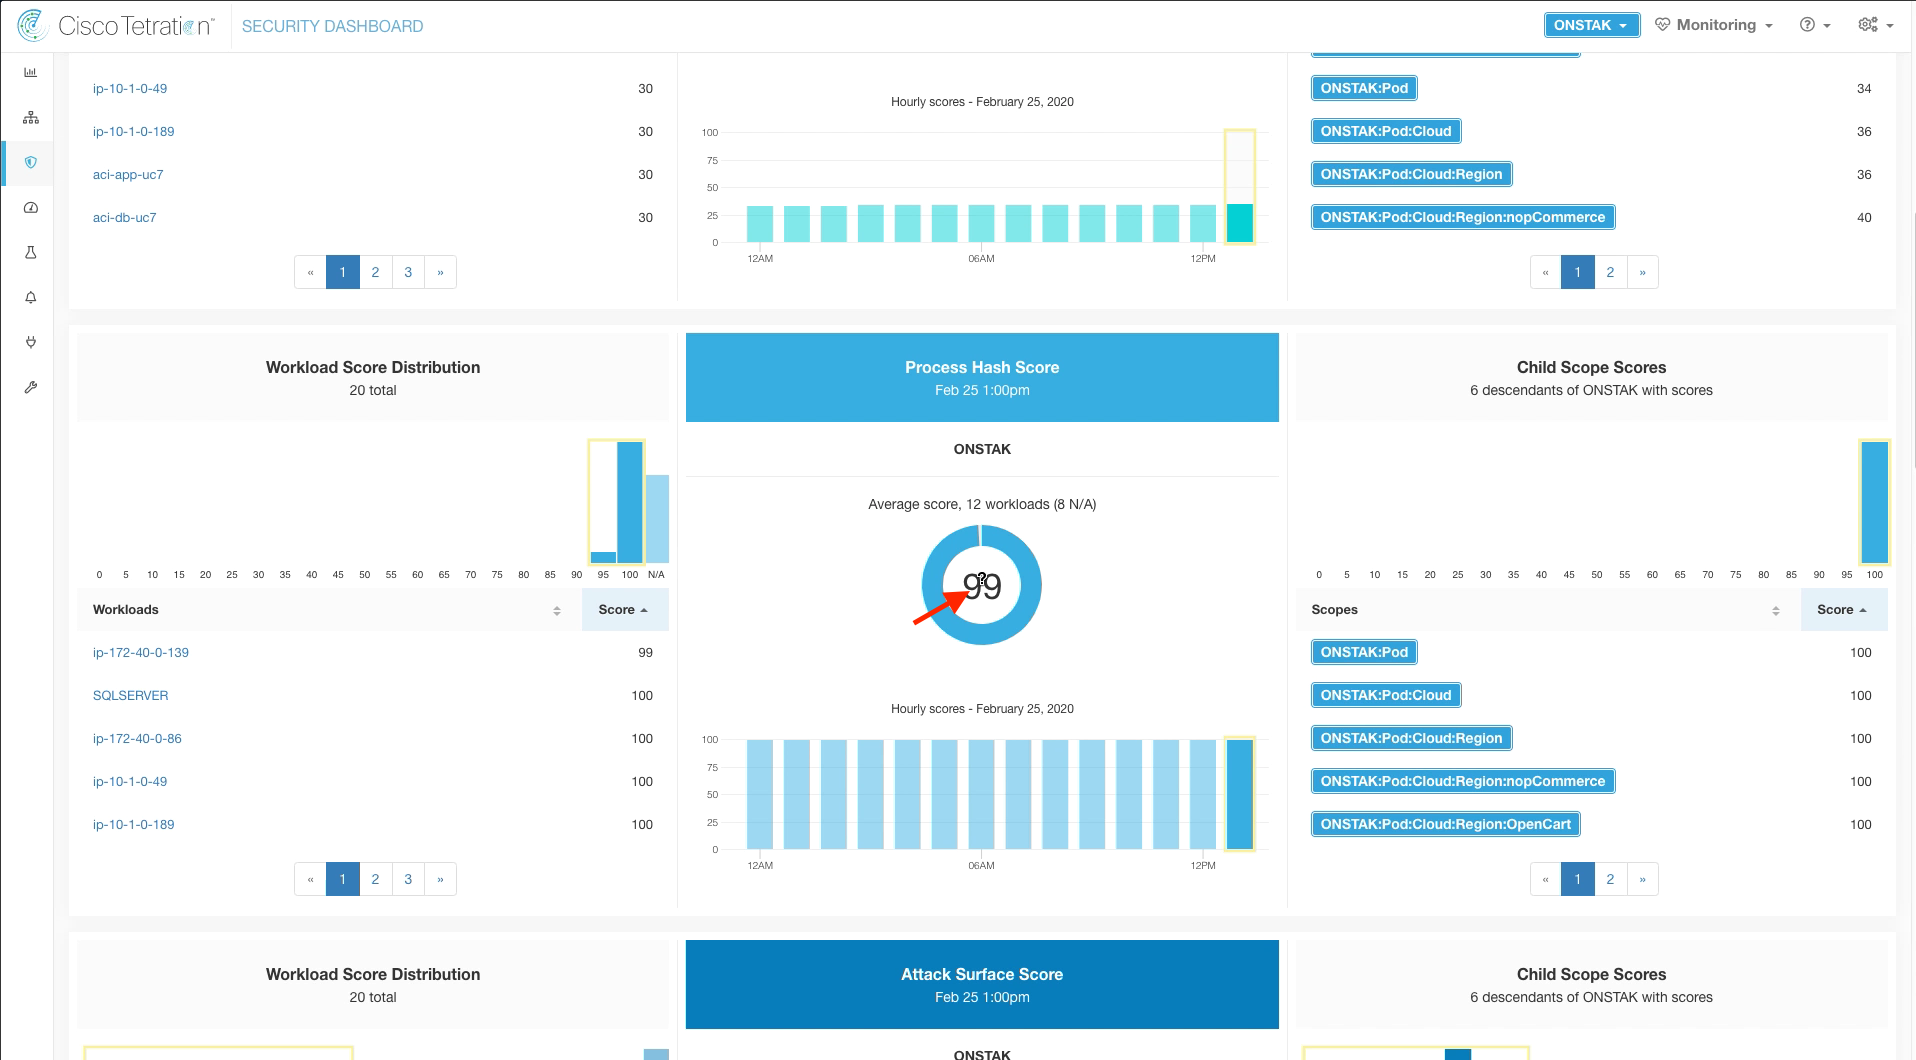
Step 003 - Examine Process Hash Score
Step 004 - Review Process Hash Score Help
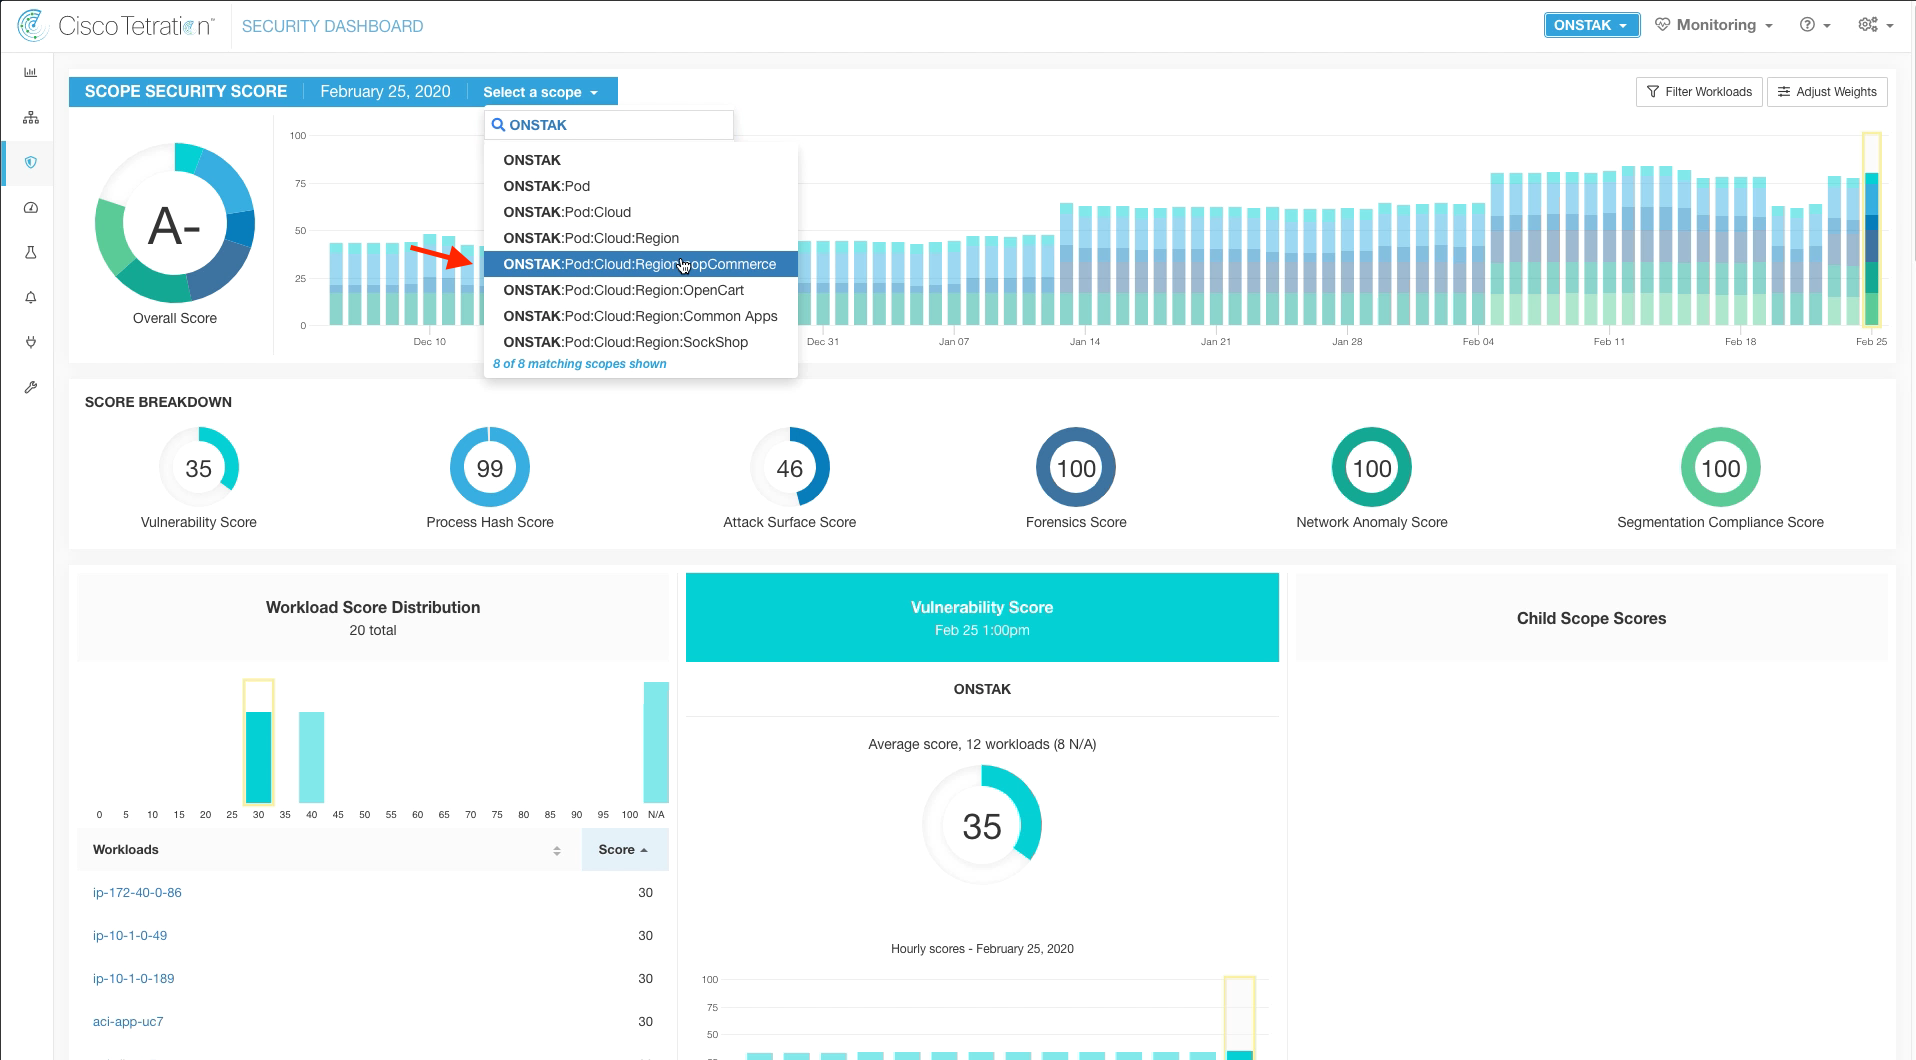
Step 005 - Change Scope to the nopCommerce application
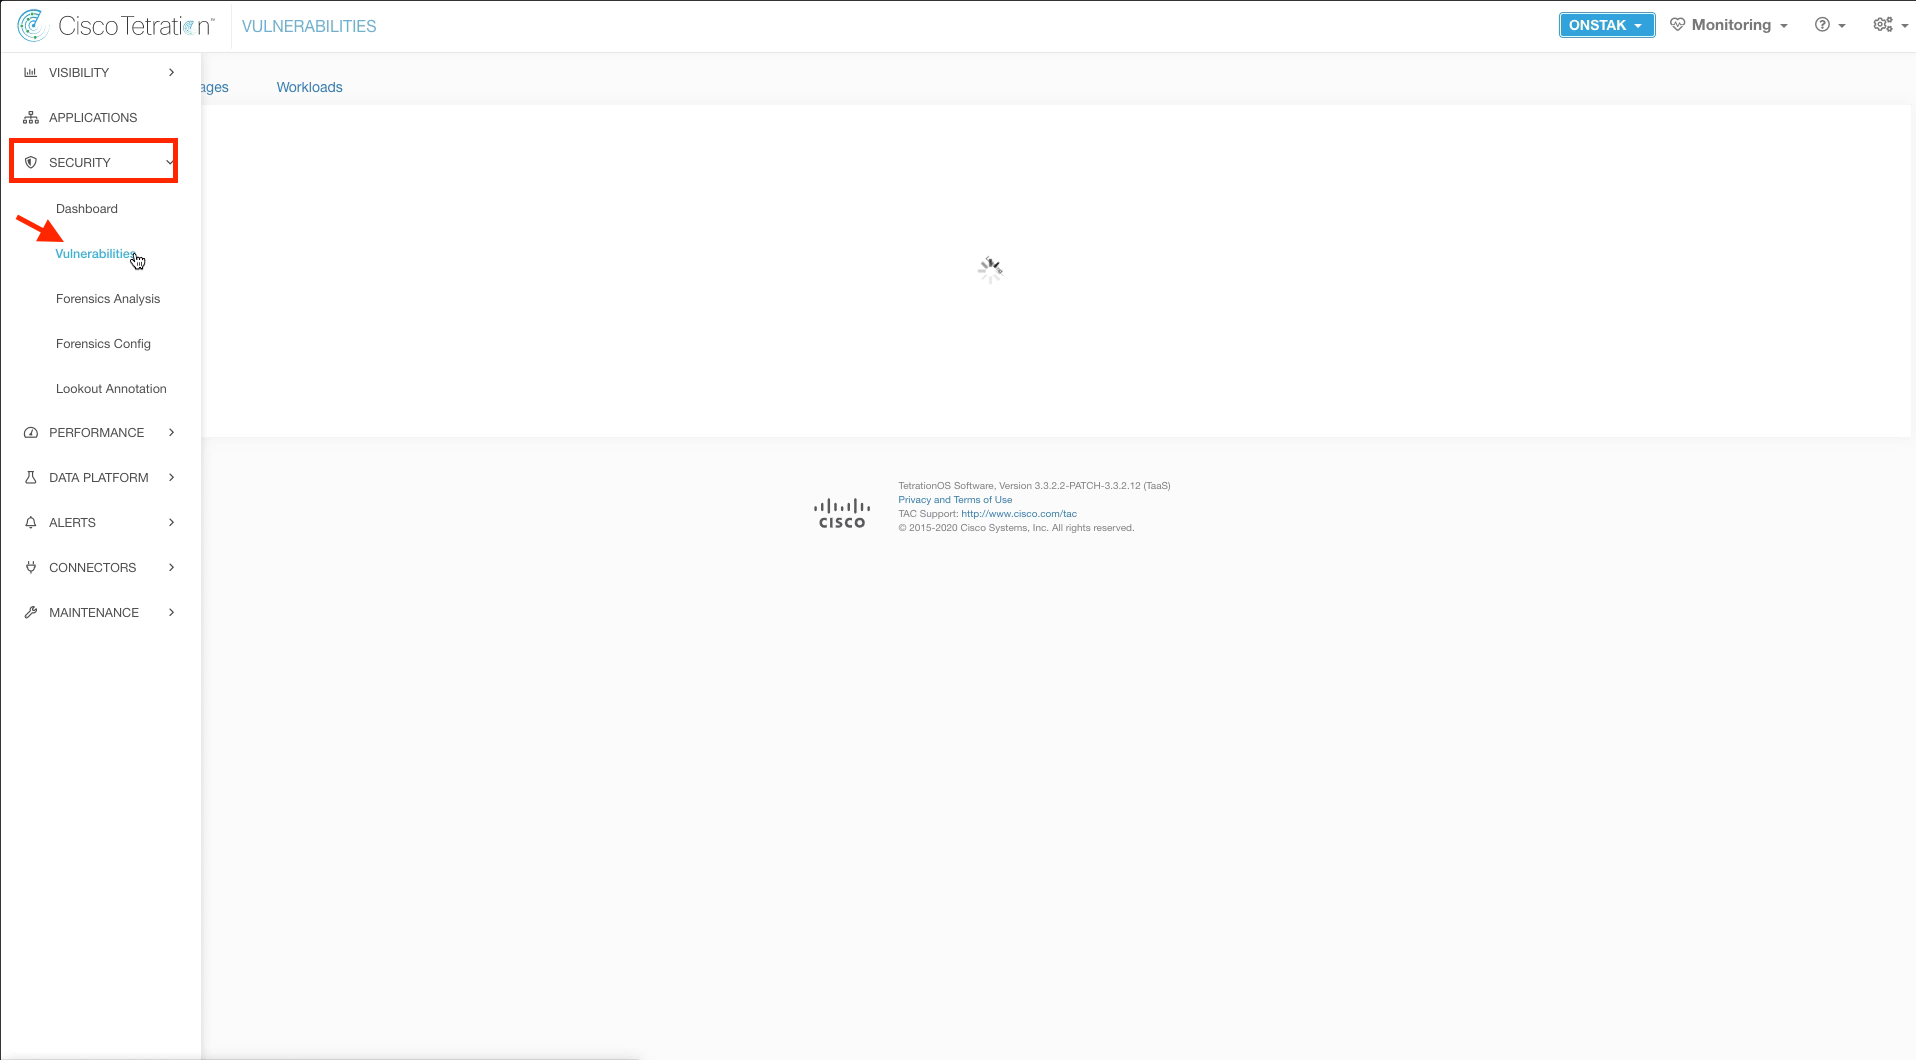
Step 006 - Navigate to the Vulnerabilities Dashboard
Step 007 - View vulnerable Packages
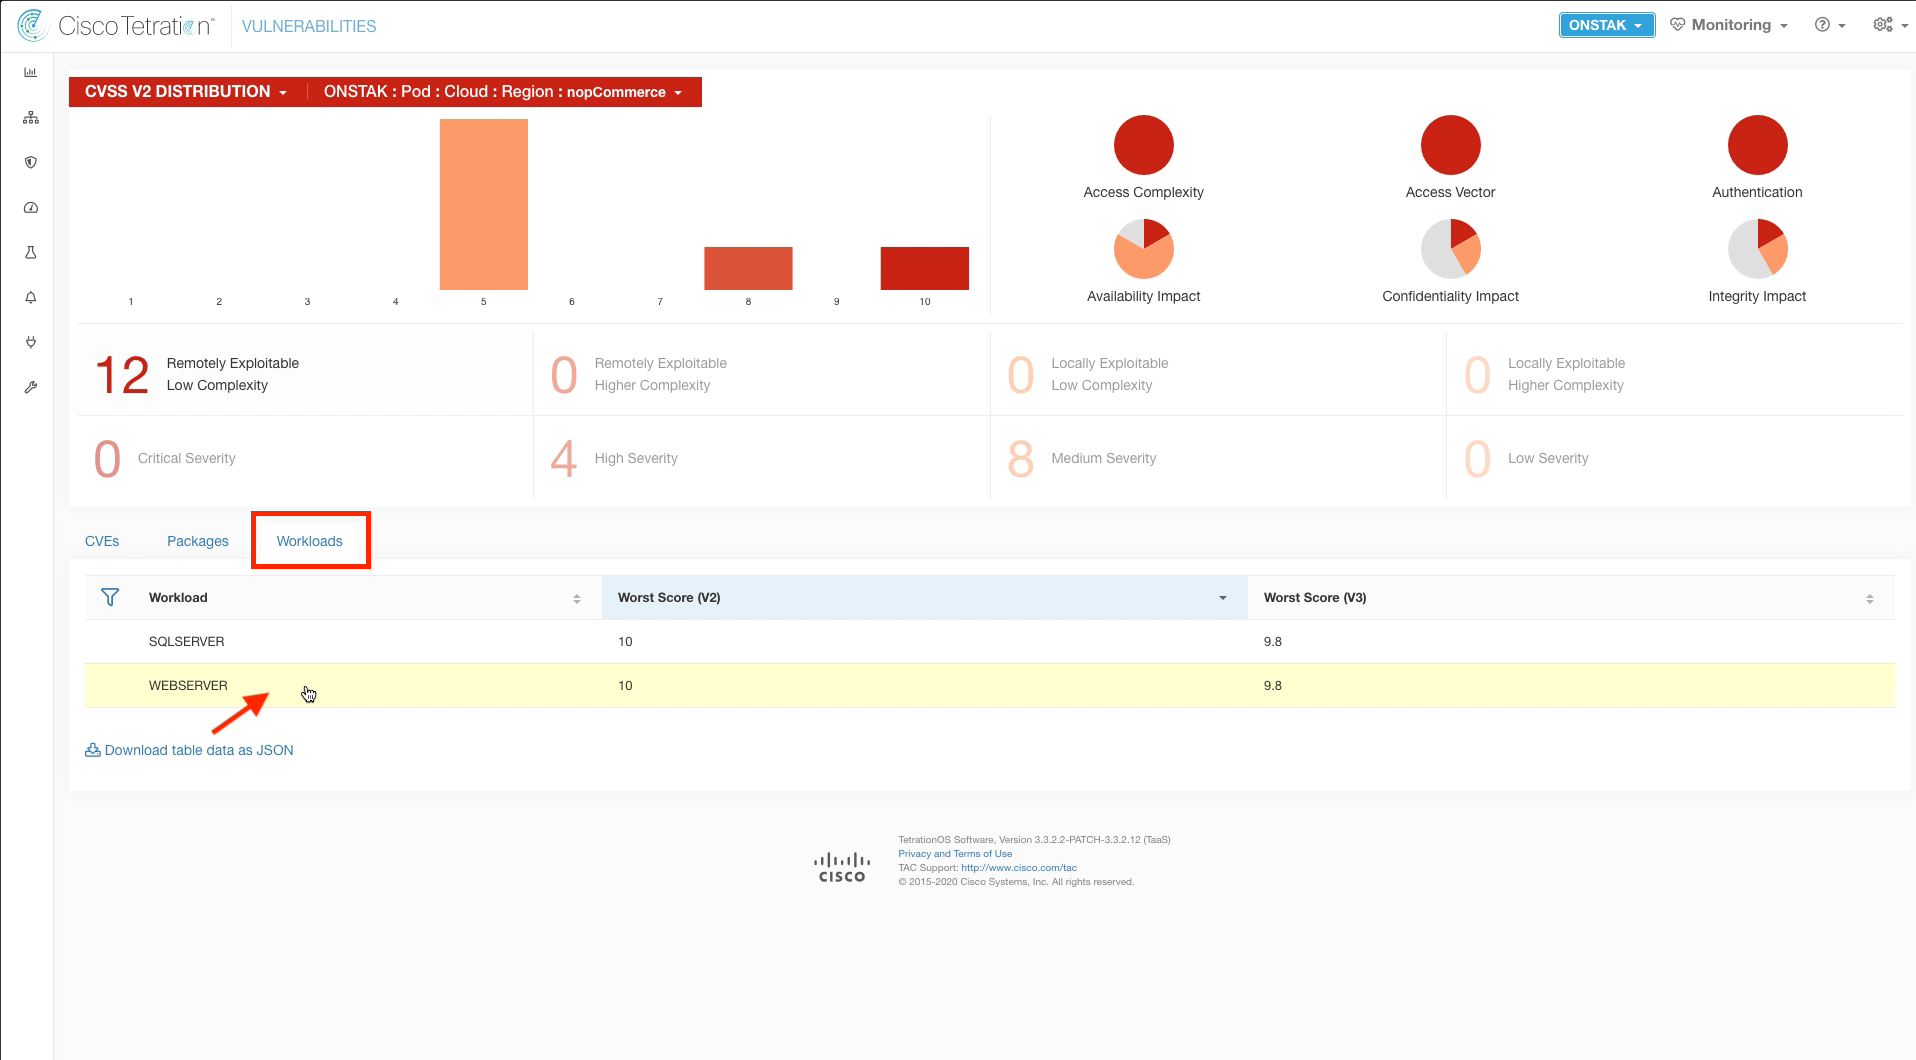
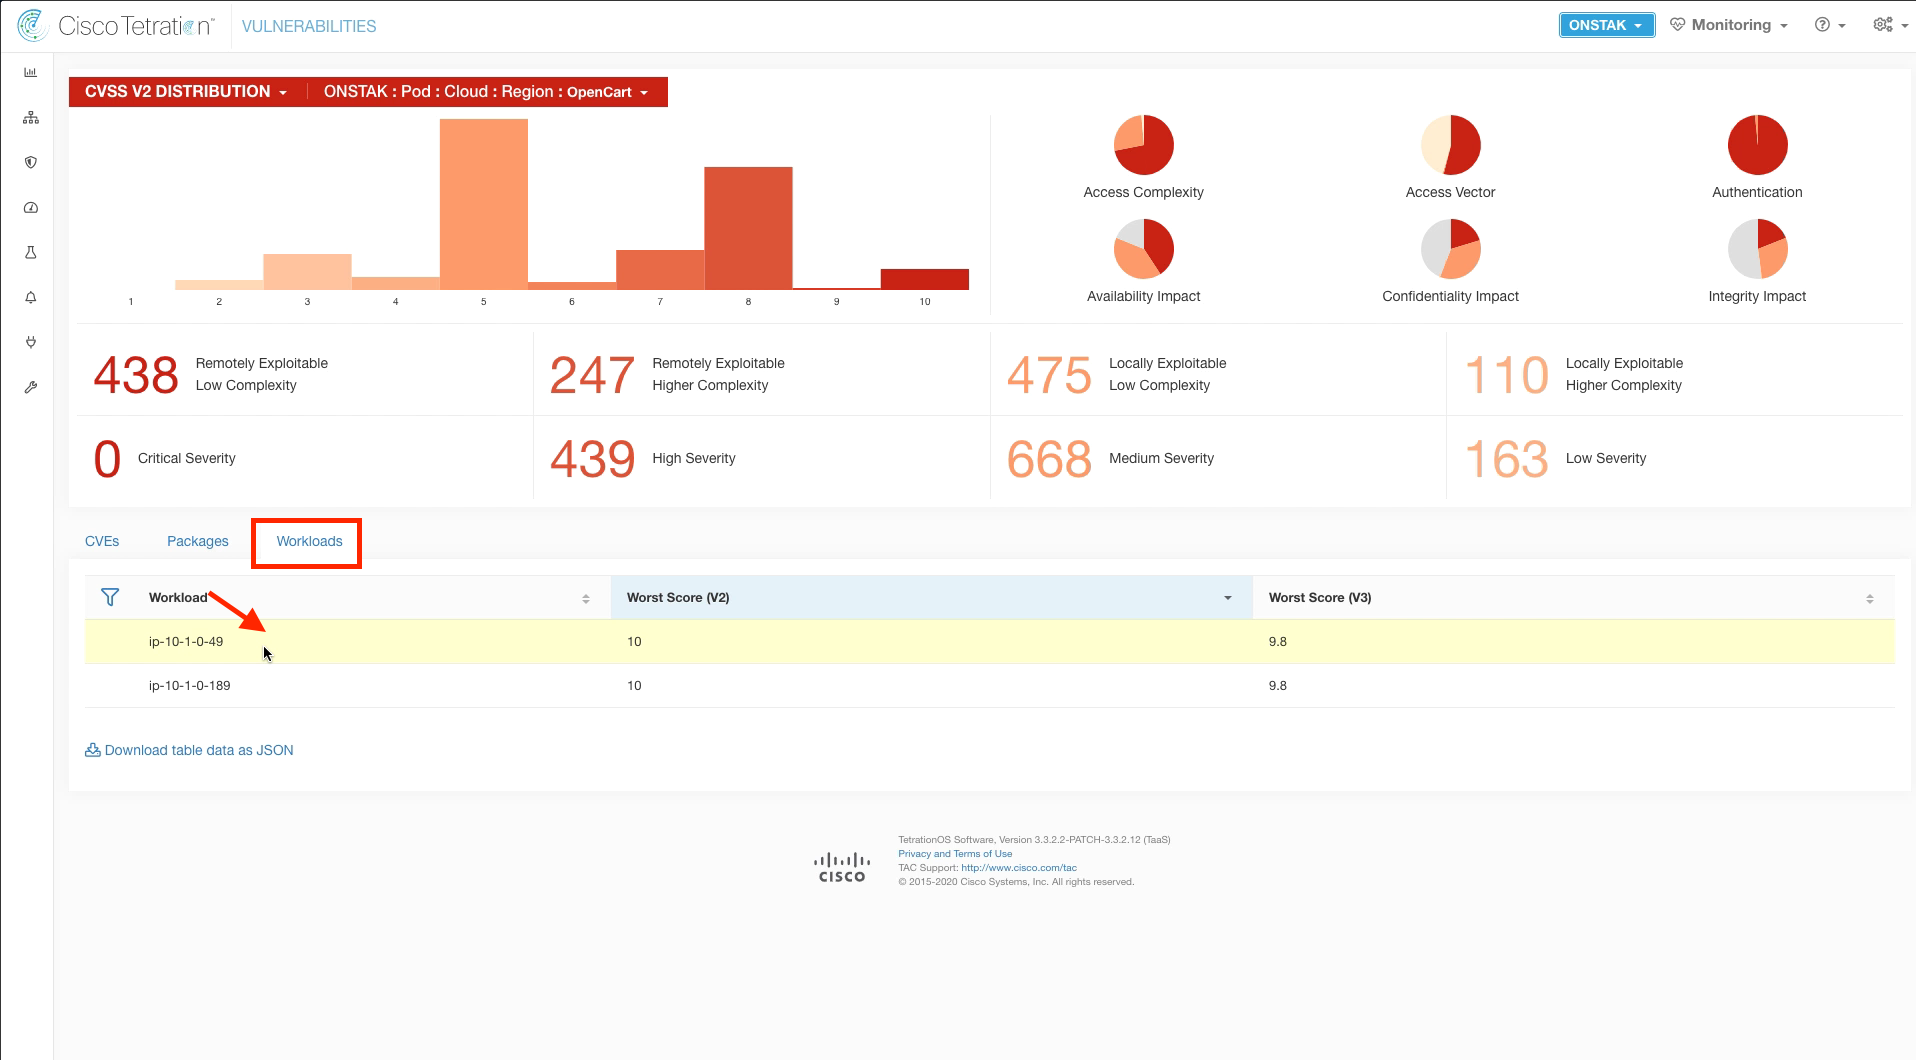
Step 008 - View vulnerable Workloads
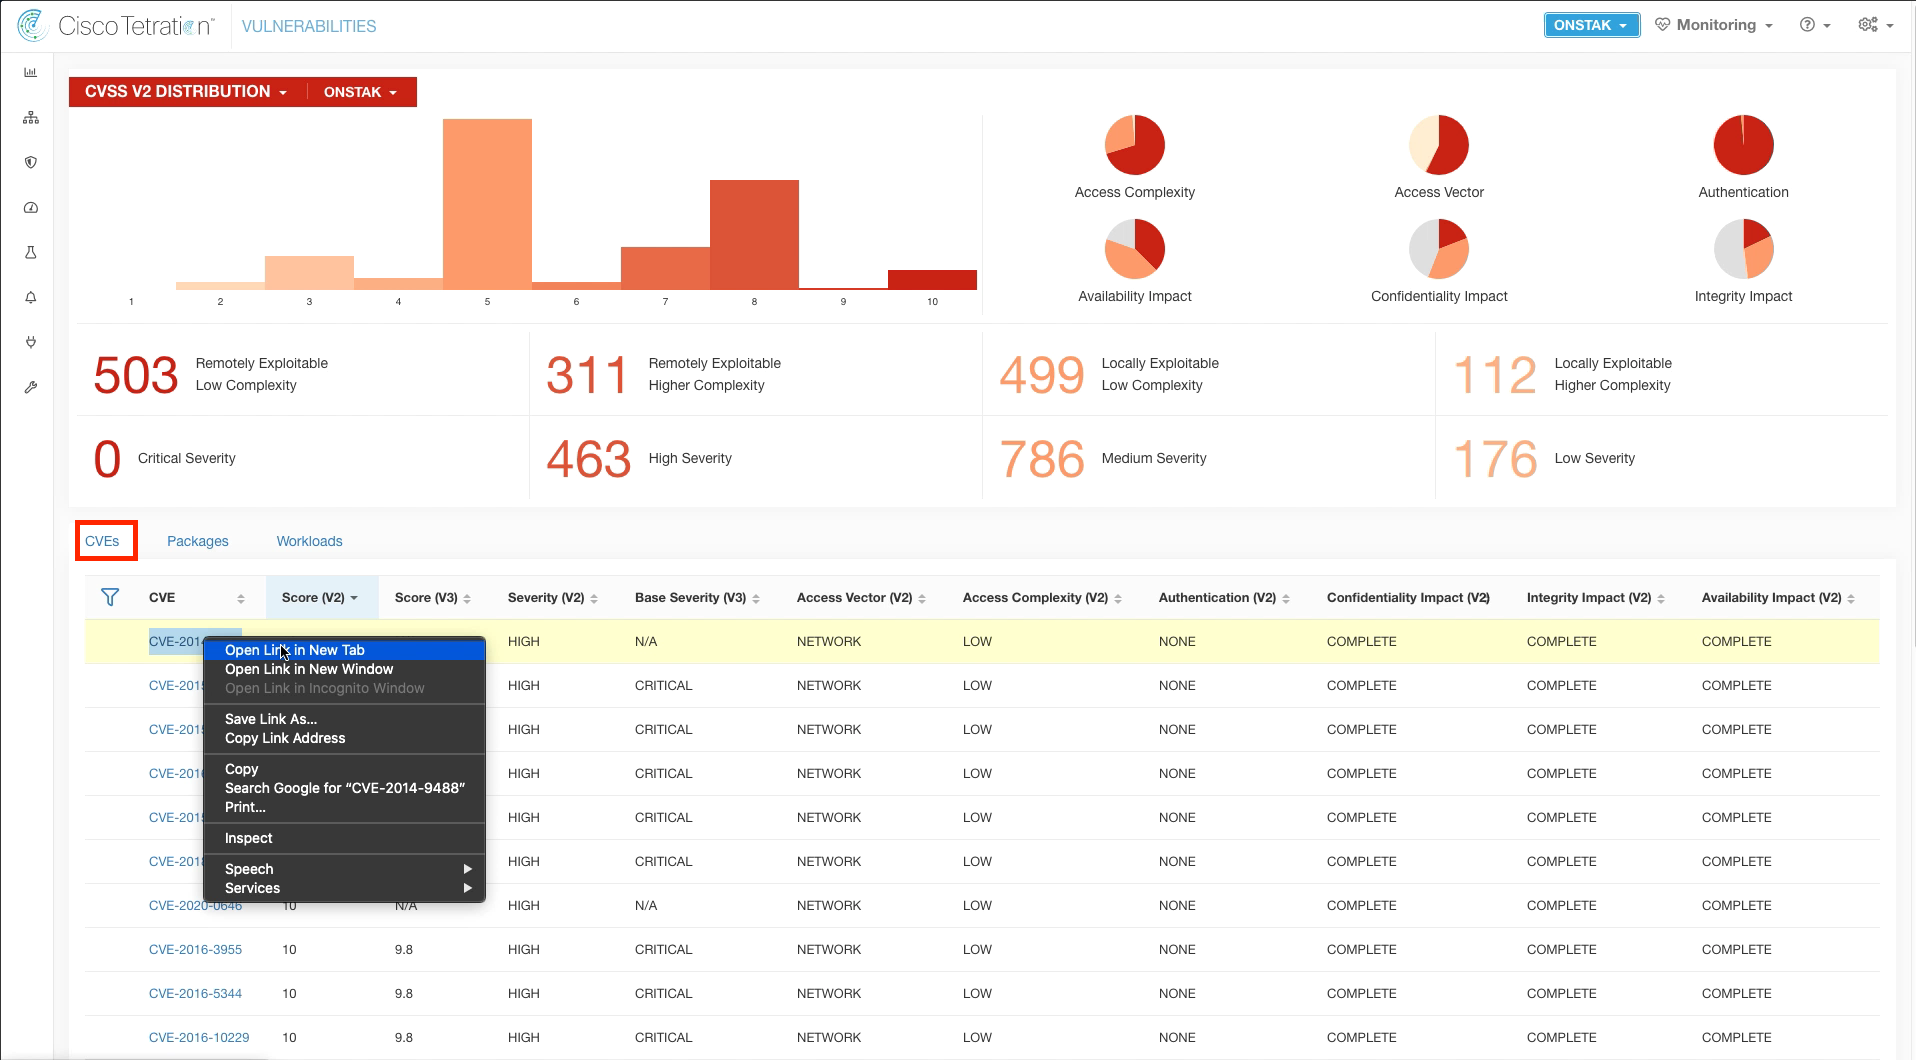
Step 009 - View CVE details
Step 010 - Review the CVE database
Step 011 - Change the Scope to the nopCommerce application
Step 012 - Examine the Remotely Exploitable vulnerabilities
Step 013 - Review vulnerable nopCommerce Workloads
Step 014 - Review IIS web server CVEs
Step 015 - Examine the NIST database
Step 016 - Navigate to vulnerabilities in the Workload Profile
Step 017 - Filter for high CVE score vulnerabilities
Step 018 - Review vulnerable packages
Step 019 - Review the Process Snapshot
Step 020 - Examine Process details
Step 021 - Navigate to the Vulnerability Dashboard
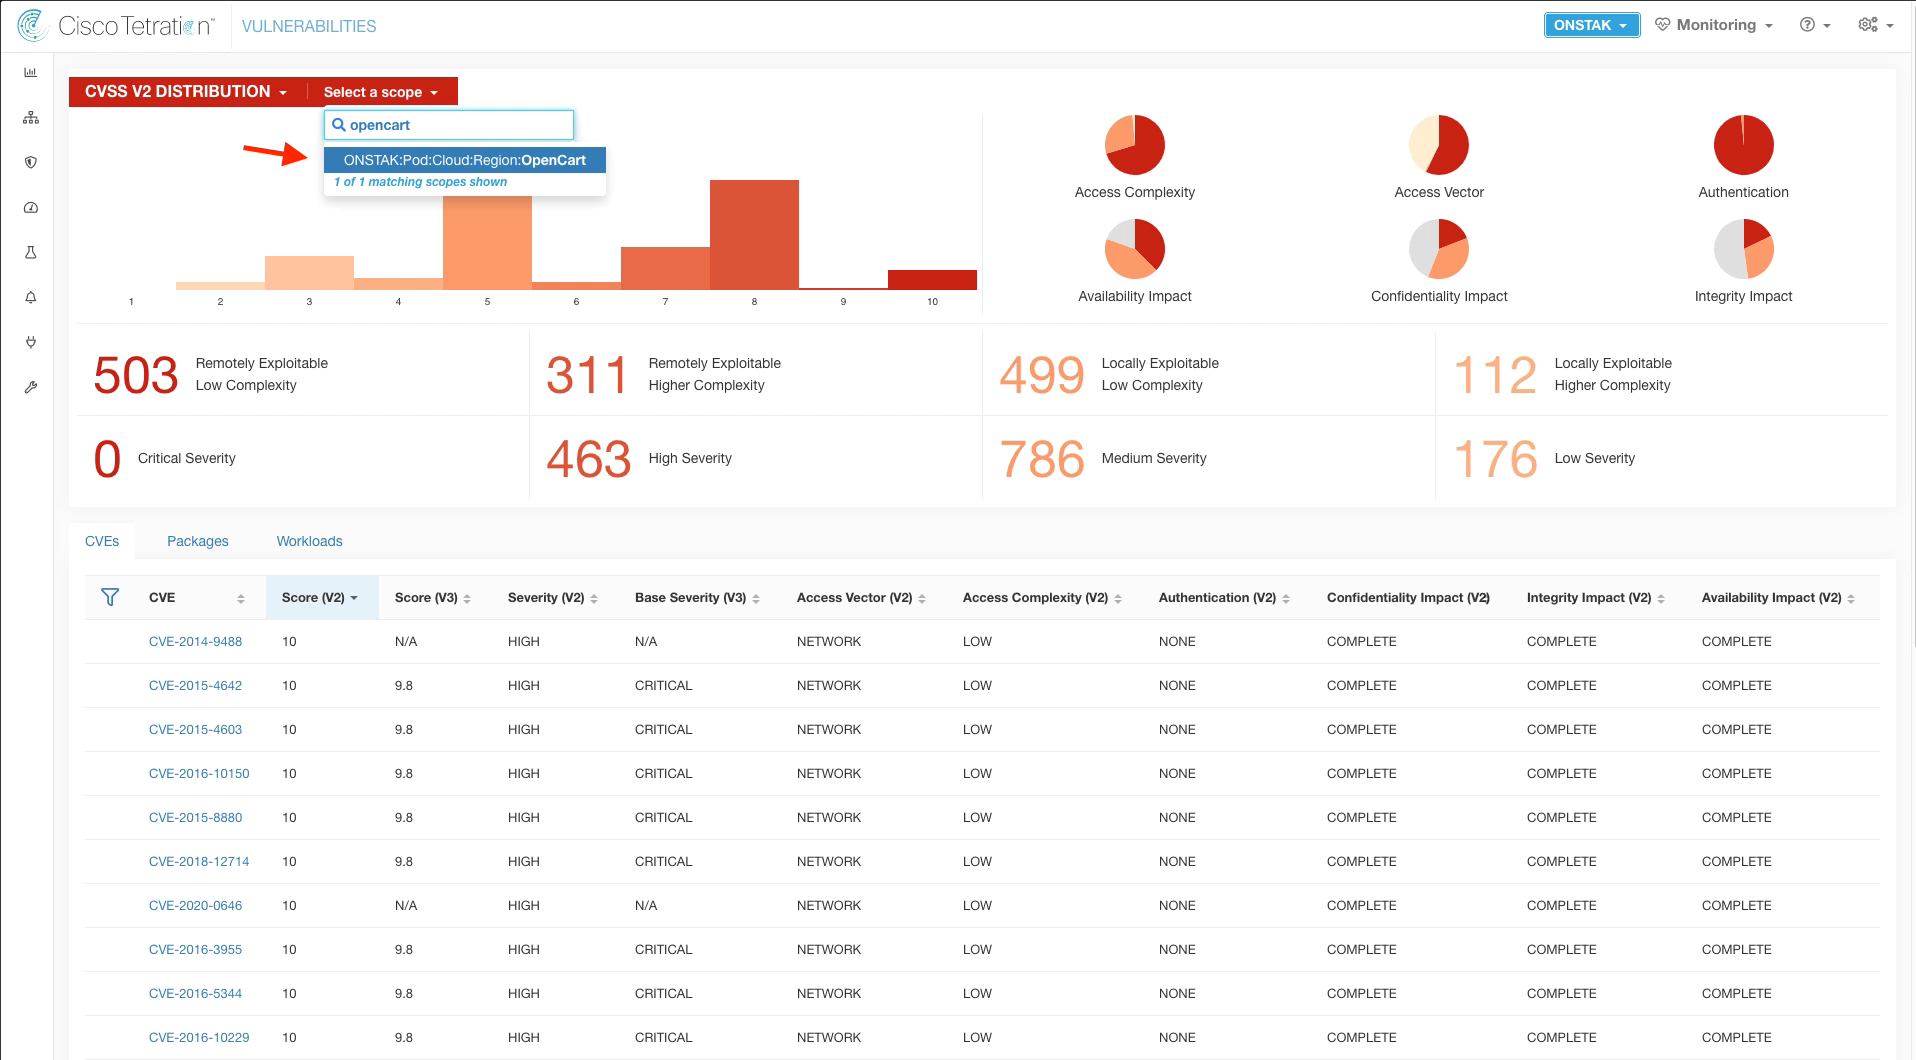
Step 022 - Change Scope to the OpenCart application
Step 023 - Select the Apache web server workload
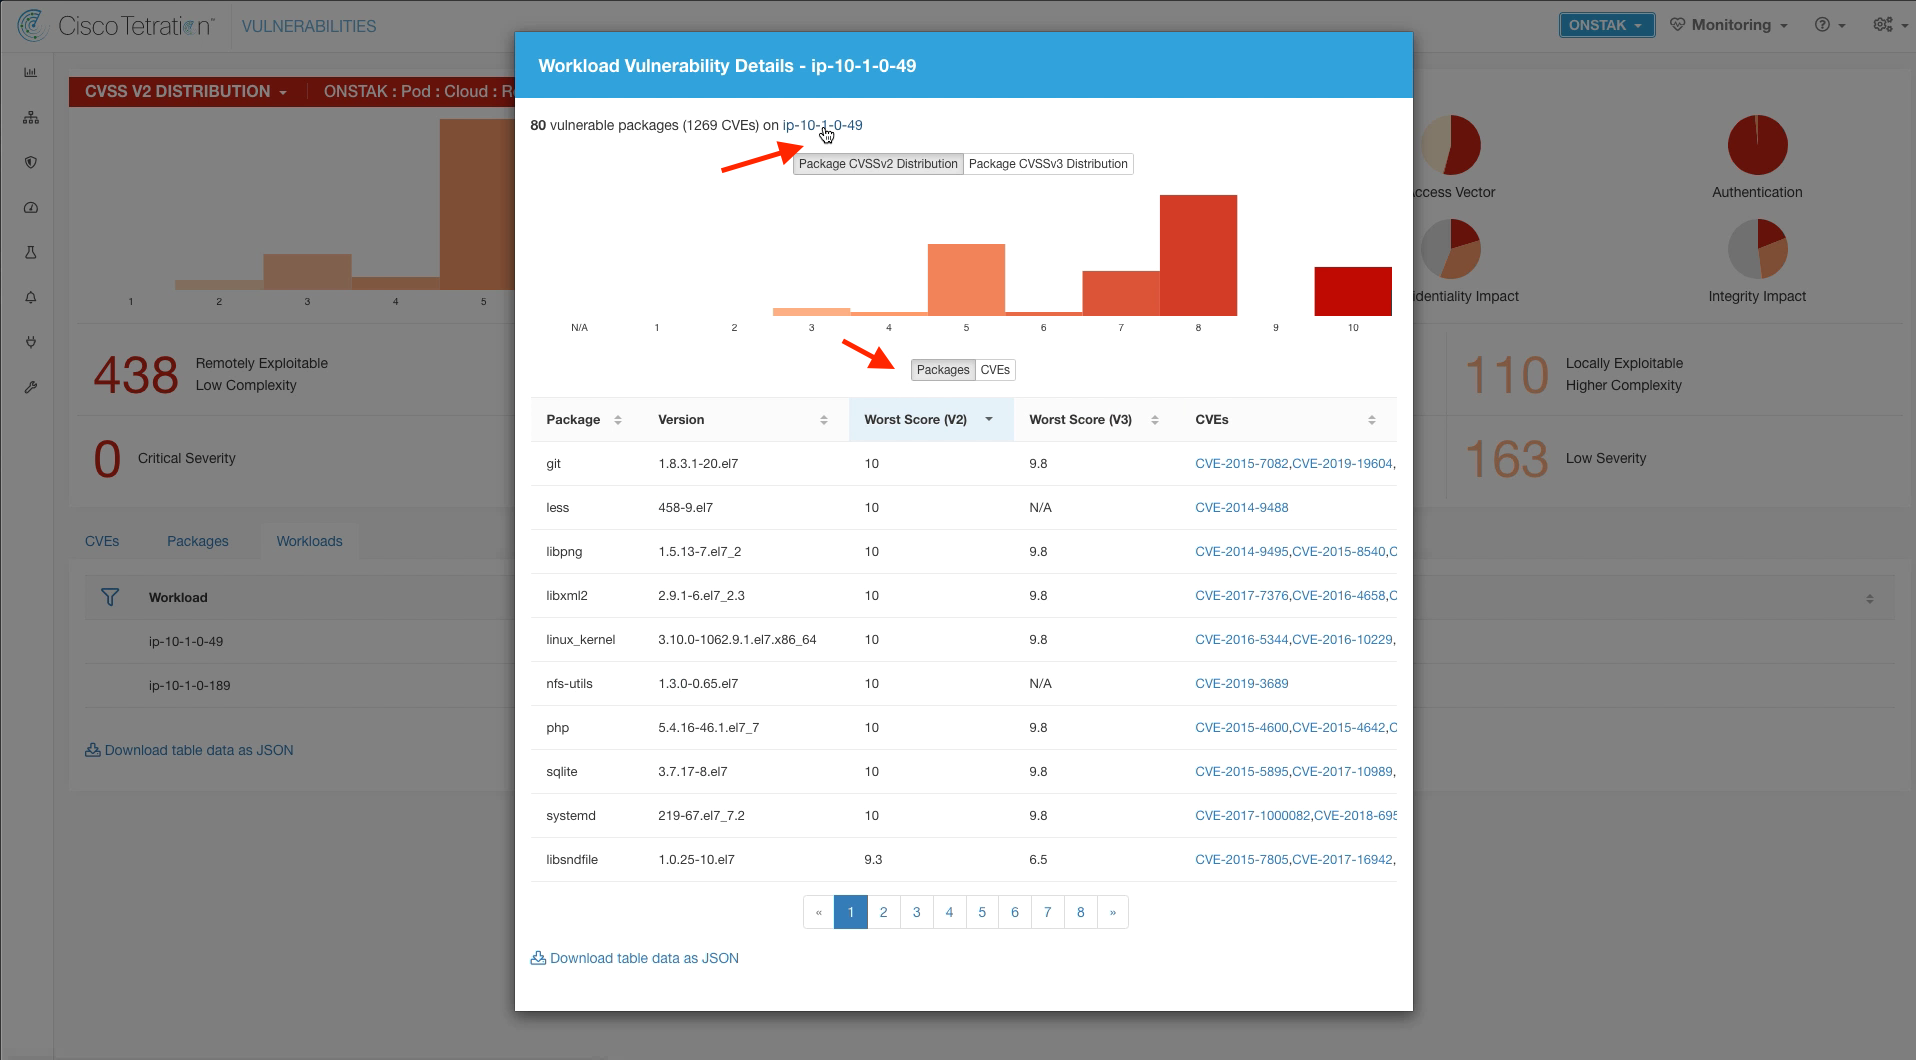
Step 024 - Review the vulnerable packages
Step 025 - Examine the Process Snapshot
Step 026 - Review process details
Step 027 - Navigate to Applications
Step 028 - Manage Alerts for an Appication Workspace
Step 029 - Configure Compliance Alerts
Step 030 - Review current alerts
Step 031 - Filter alerts by severity
Step 032 - Navigate to alert configuration
Step 033 - View alert destinations
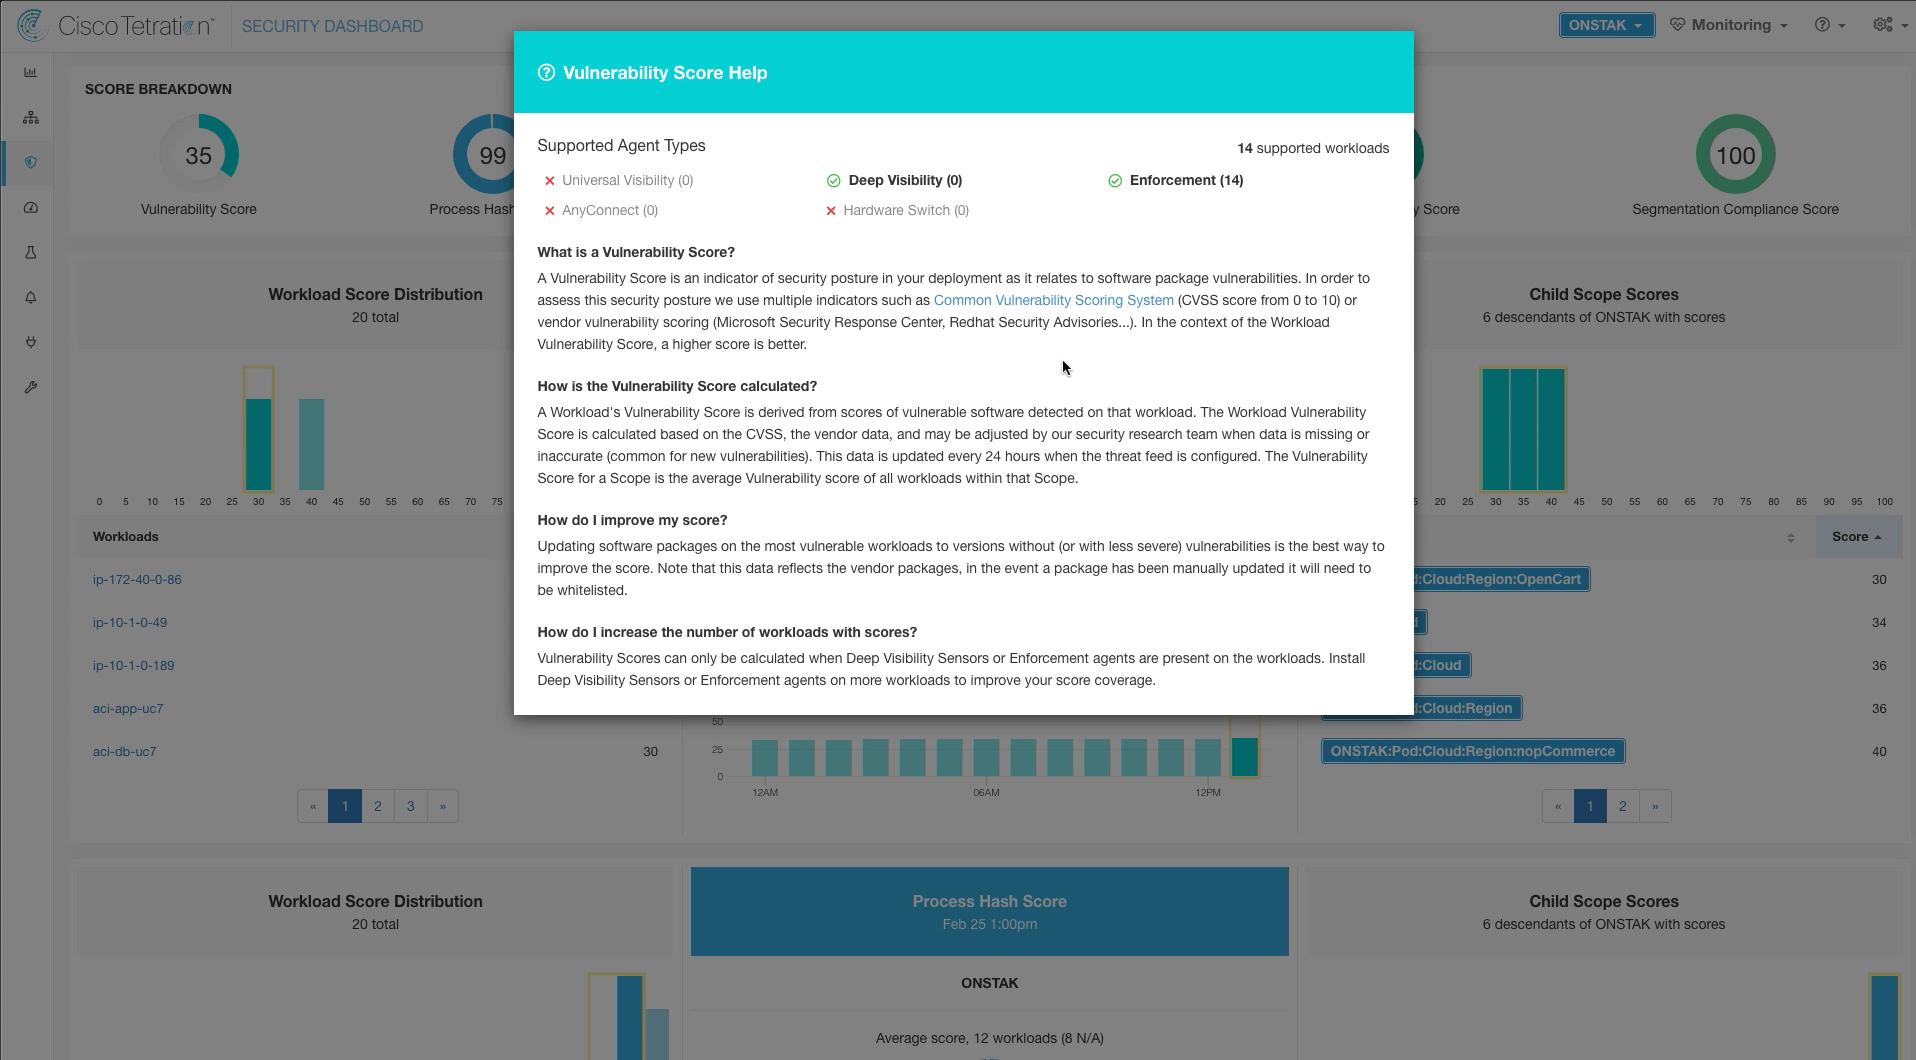
Click on the Vulnerability Score on the main dashboard to view Vulnerability Score Help.
The help screen provides explanation of the vulnerability score, how it is calculated, and details on how to improve the score.
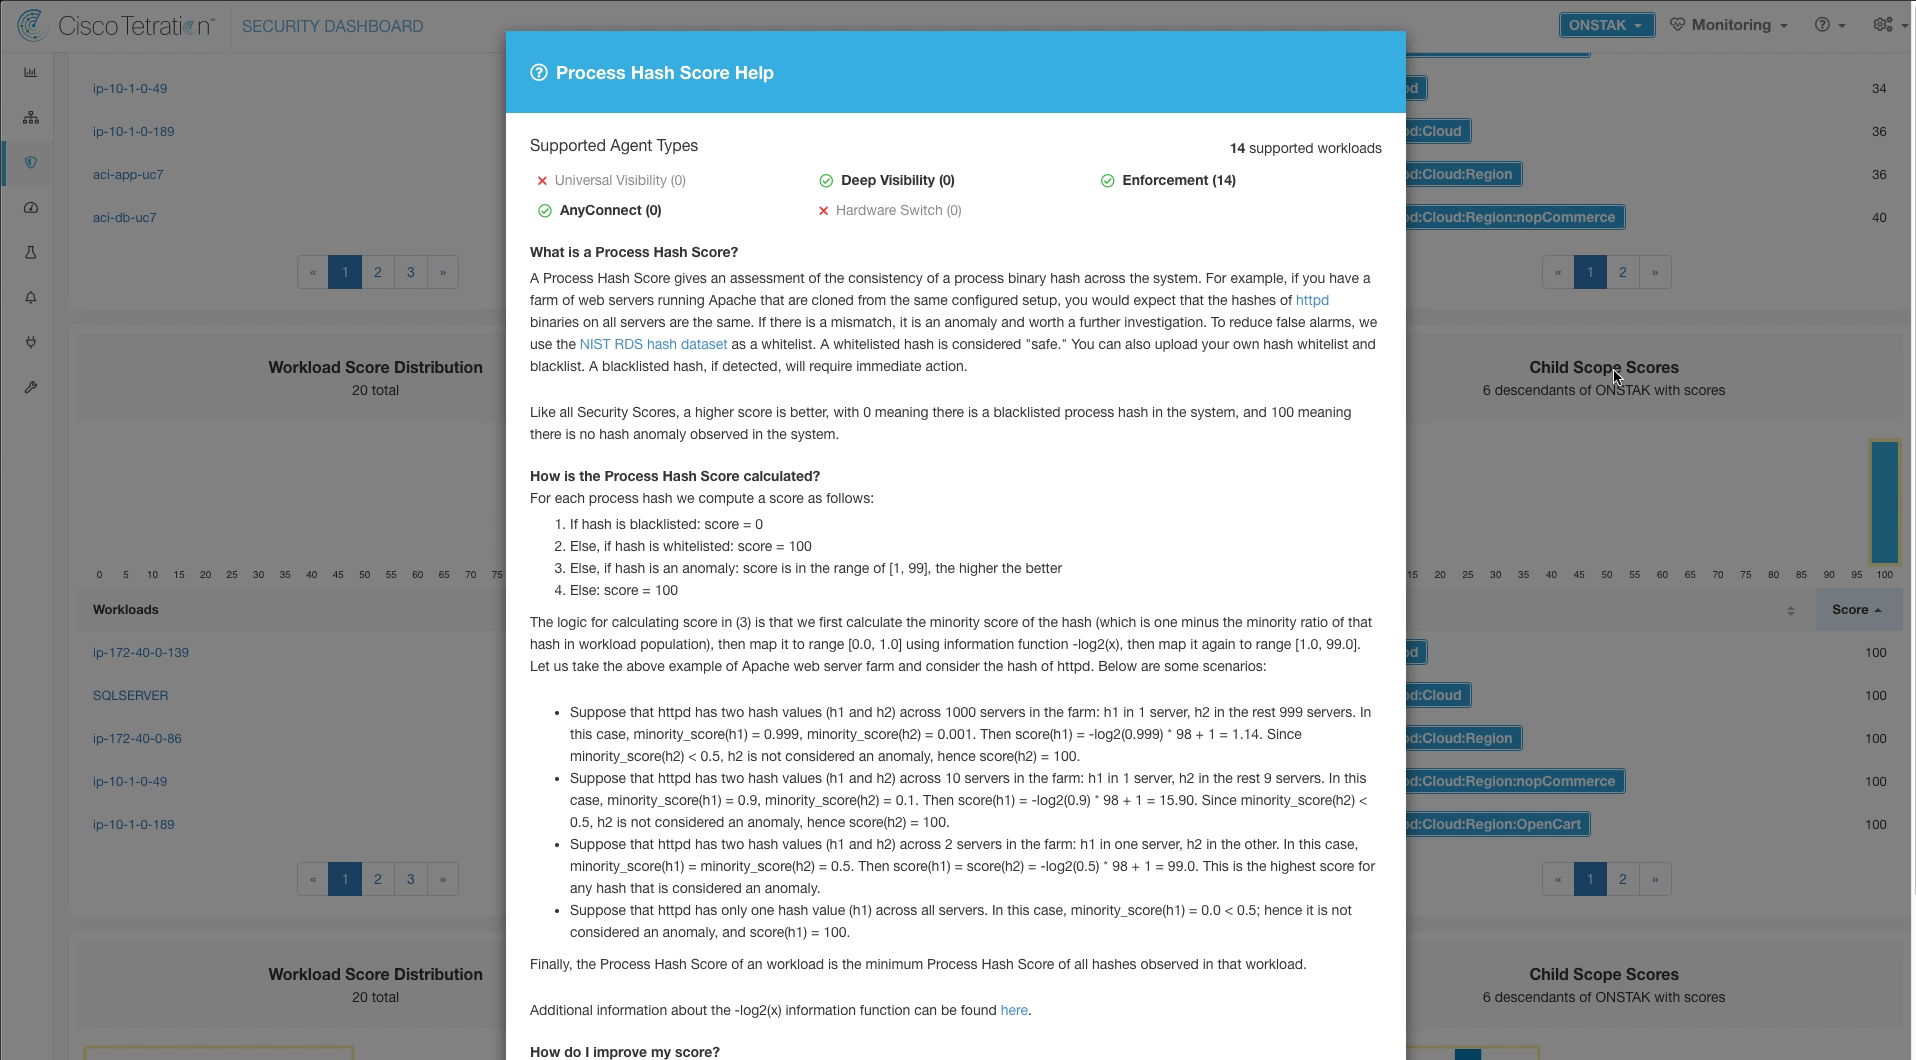
Scroll down and click on the Process Hash score to reveal Process Hash help.
The help screen provides information on what agents are supported as well as how the score is calculated and how to improve the score. Each of the vulnerability score sections has a similar help screen.
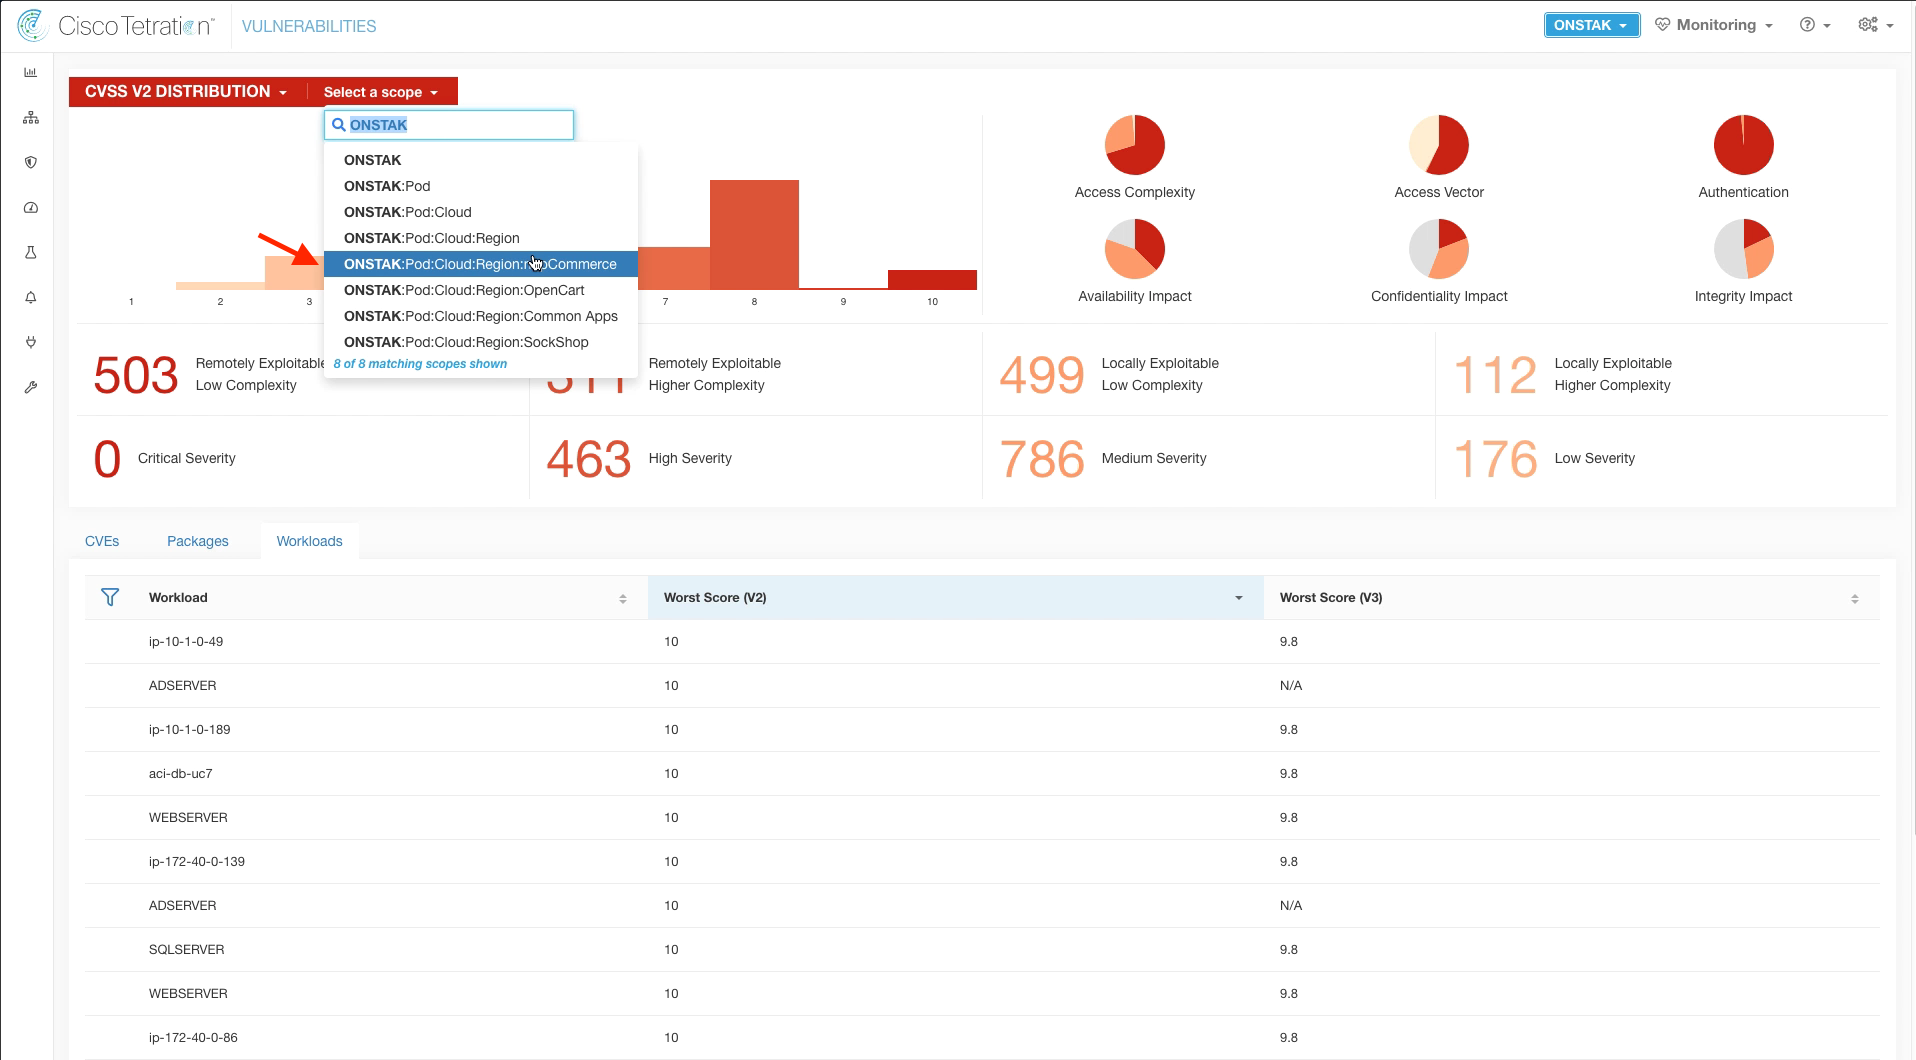
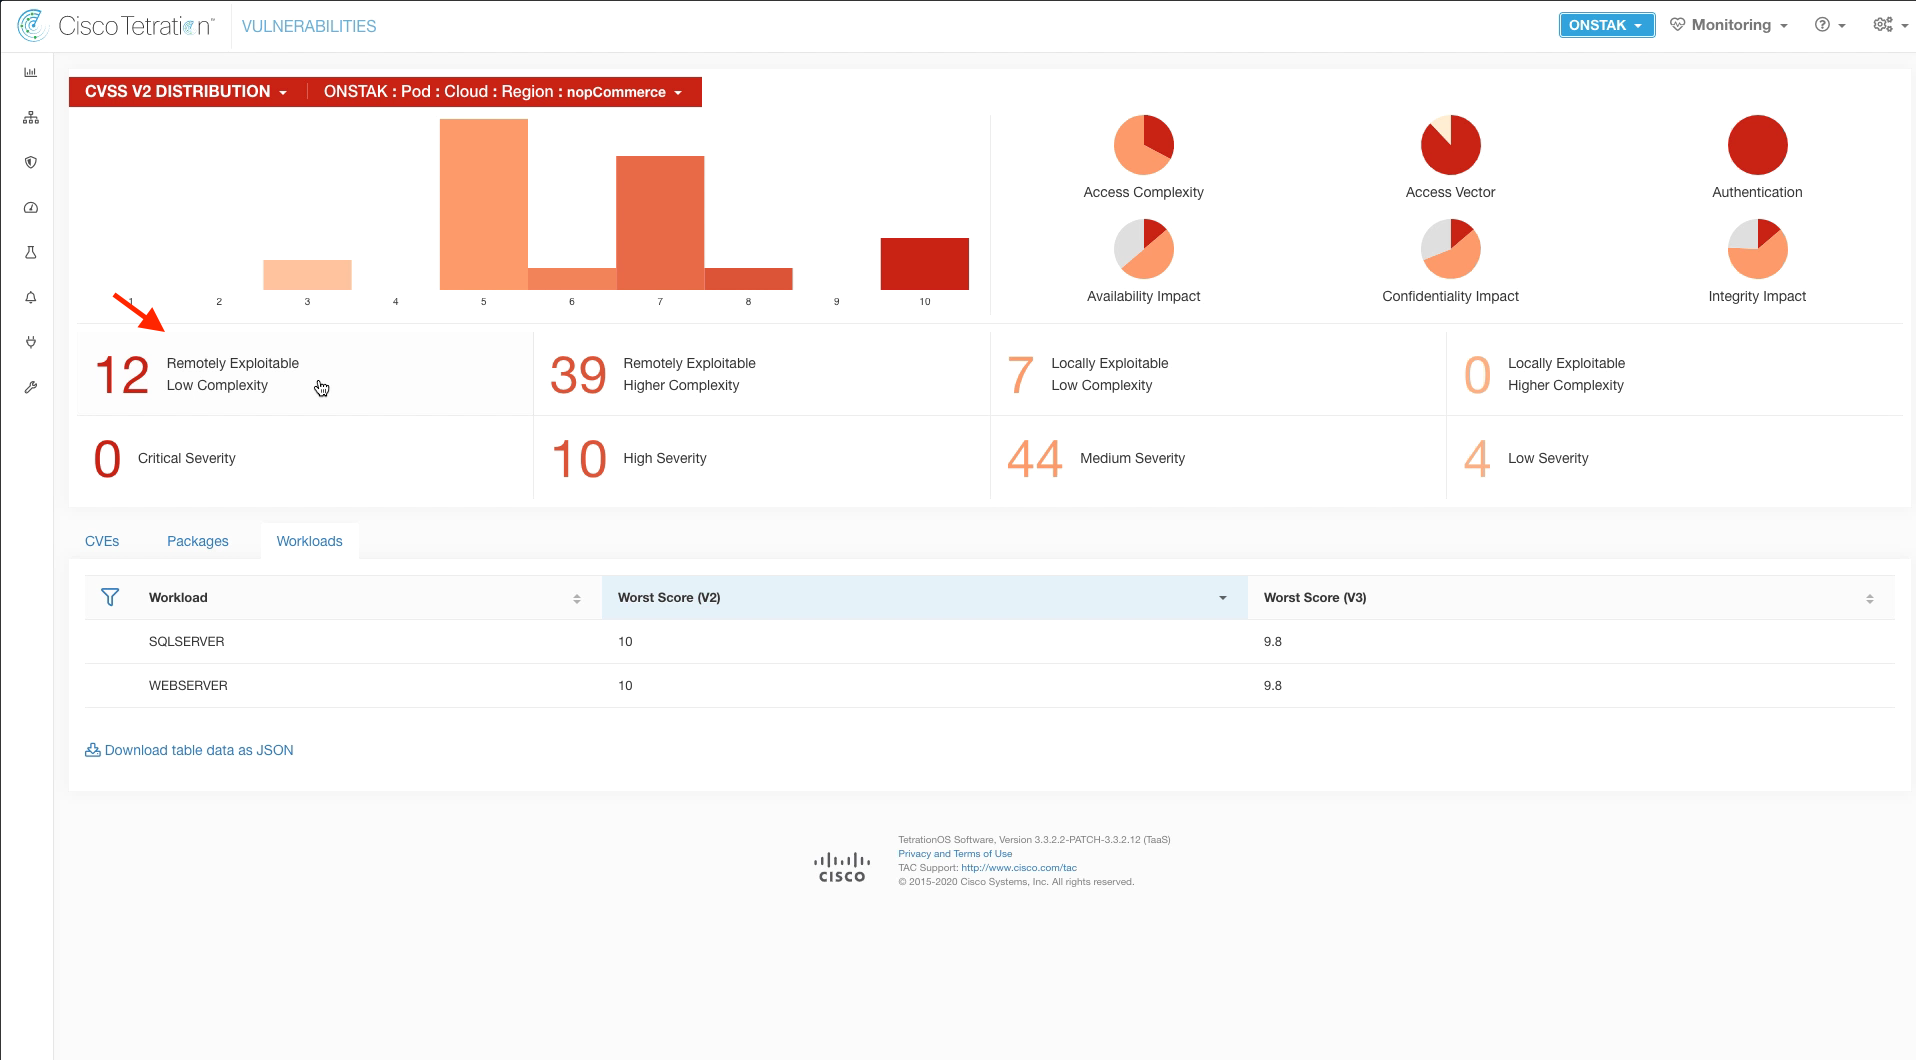
By default you are viewing the overall score for all applications and workloads that are installed with Tetration sensors. It is also possible to drill down to a specific application by changing the Scope. Change the scope to the nopCommerce application and review how the dashboard has changed to now more specific scores for the nopCommerce application and workloads.
Navigate to the Vulnerability dashboard.
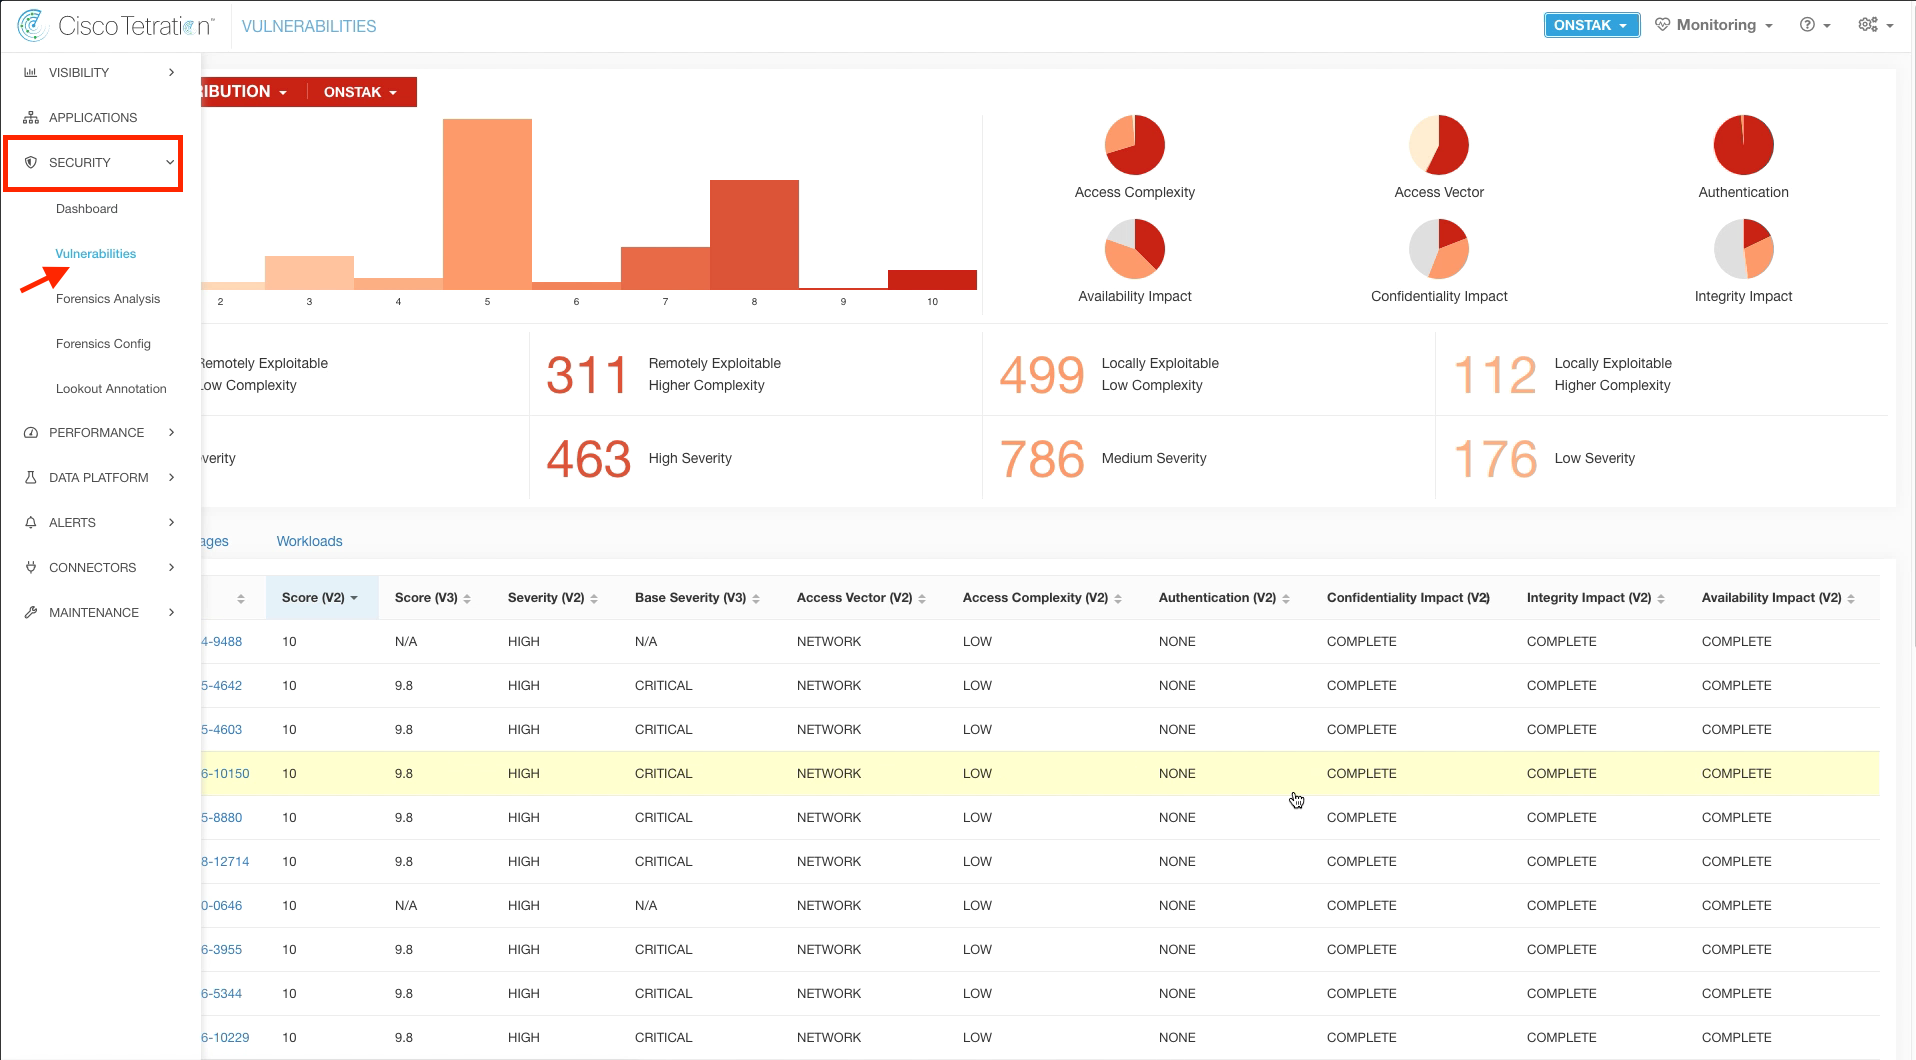
There are three main tabs; CVEs, Packages, and Workloads. Click on the Packages tab and review the vulnerable packages.
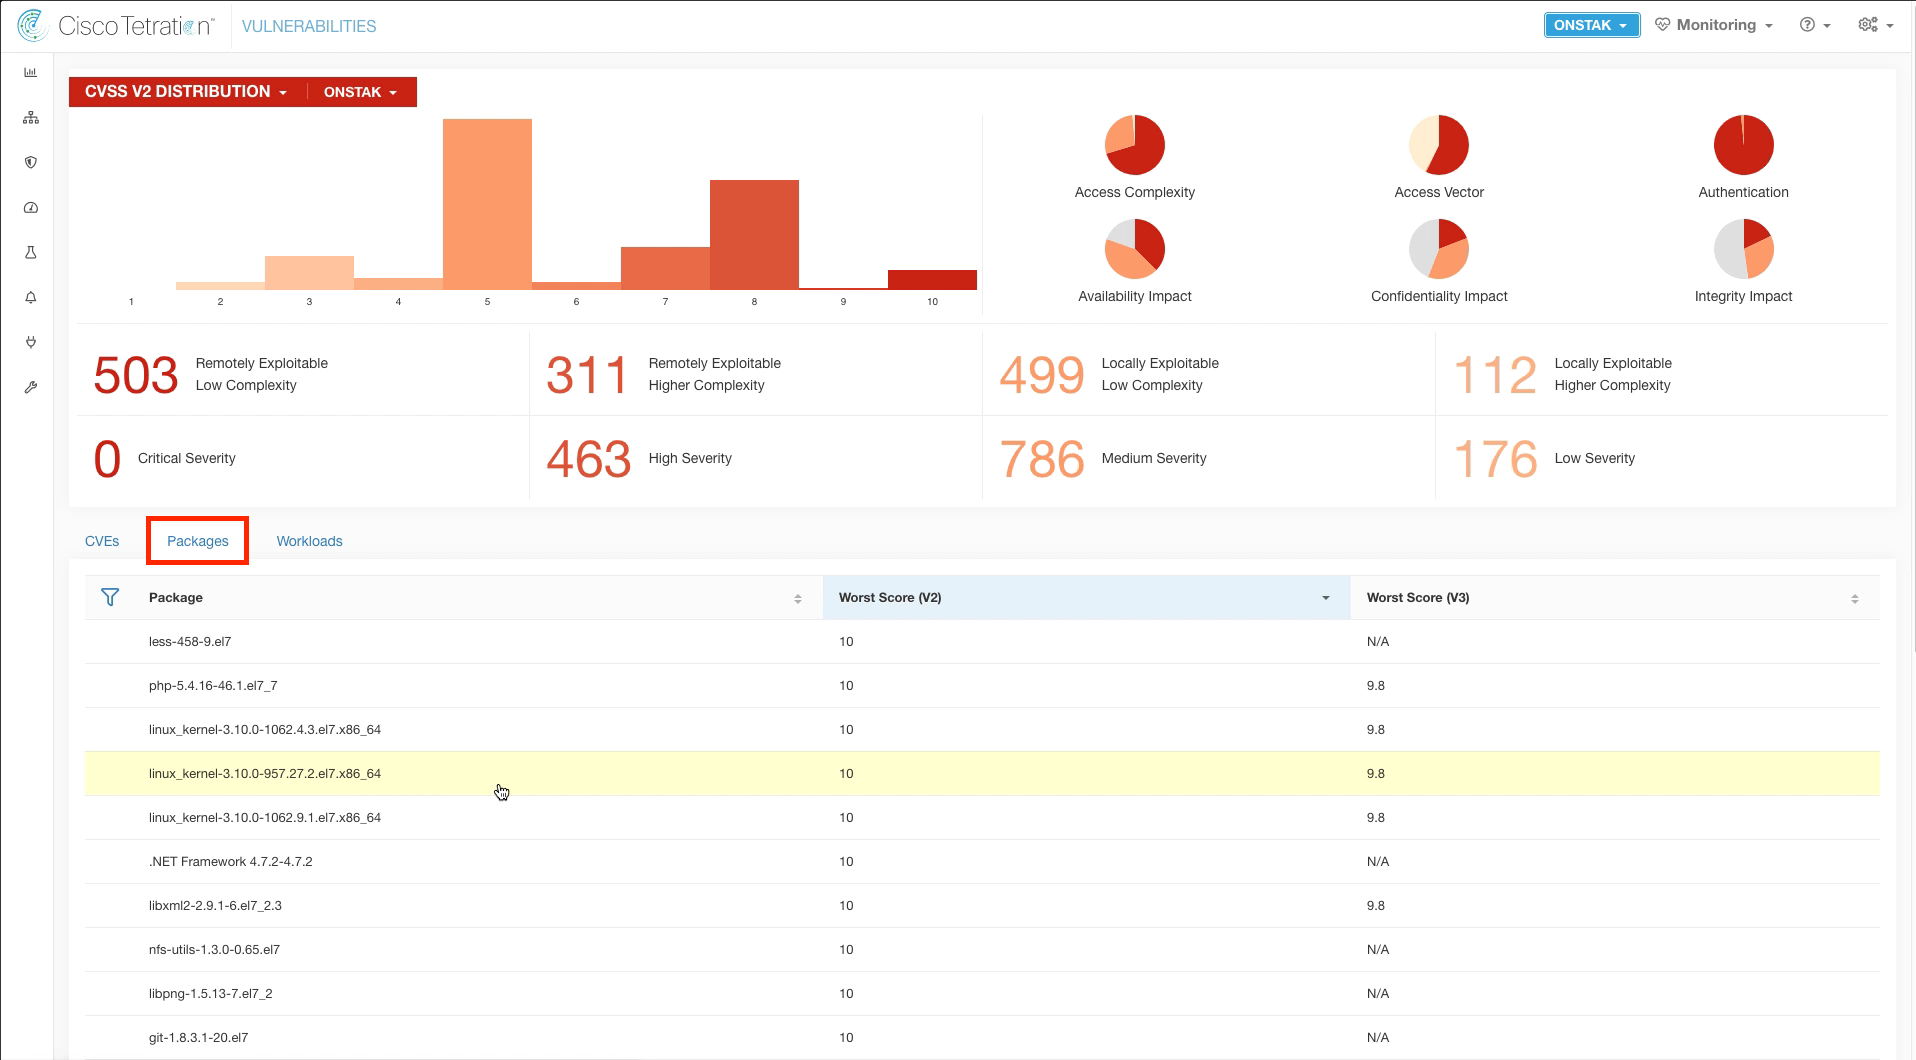
Click on the Workloads tab. This shows all of the workloads in the environment that are installed with Tetration sensors and their CVE score.
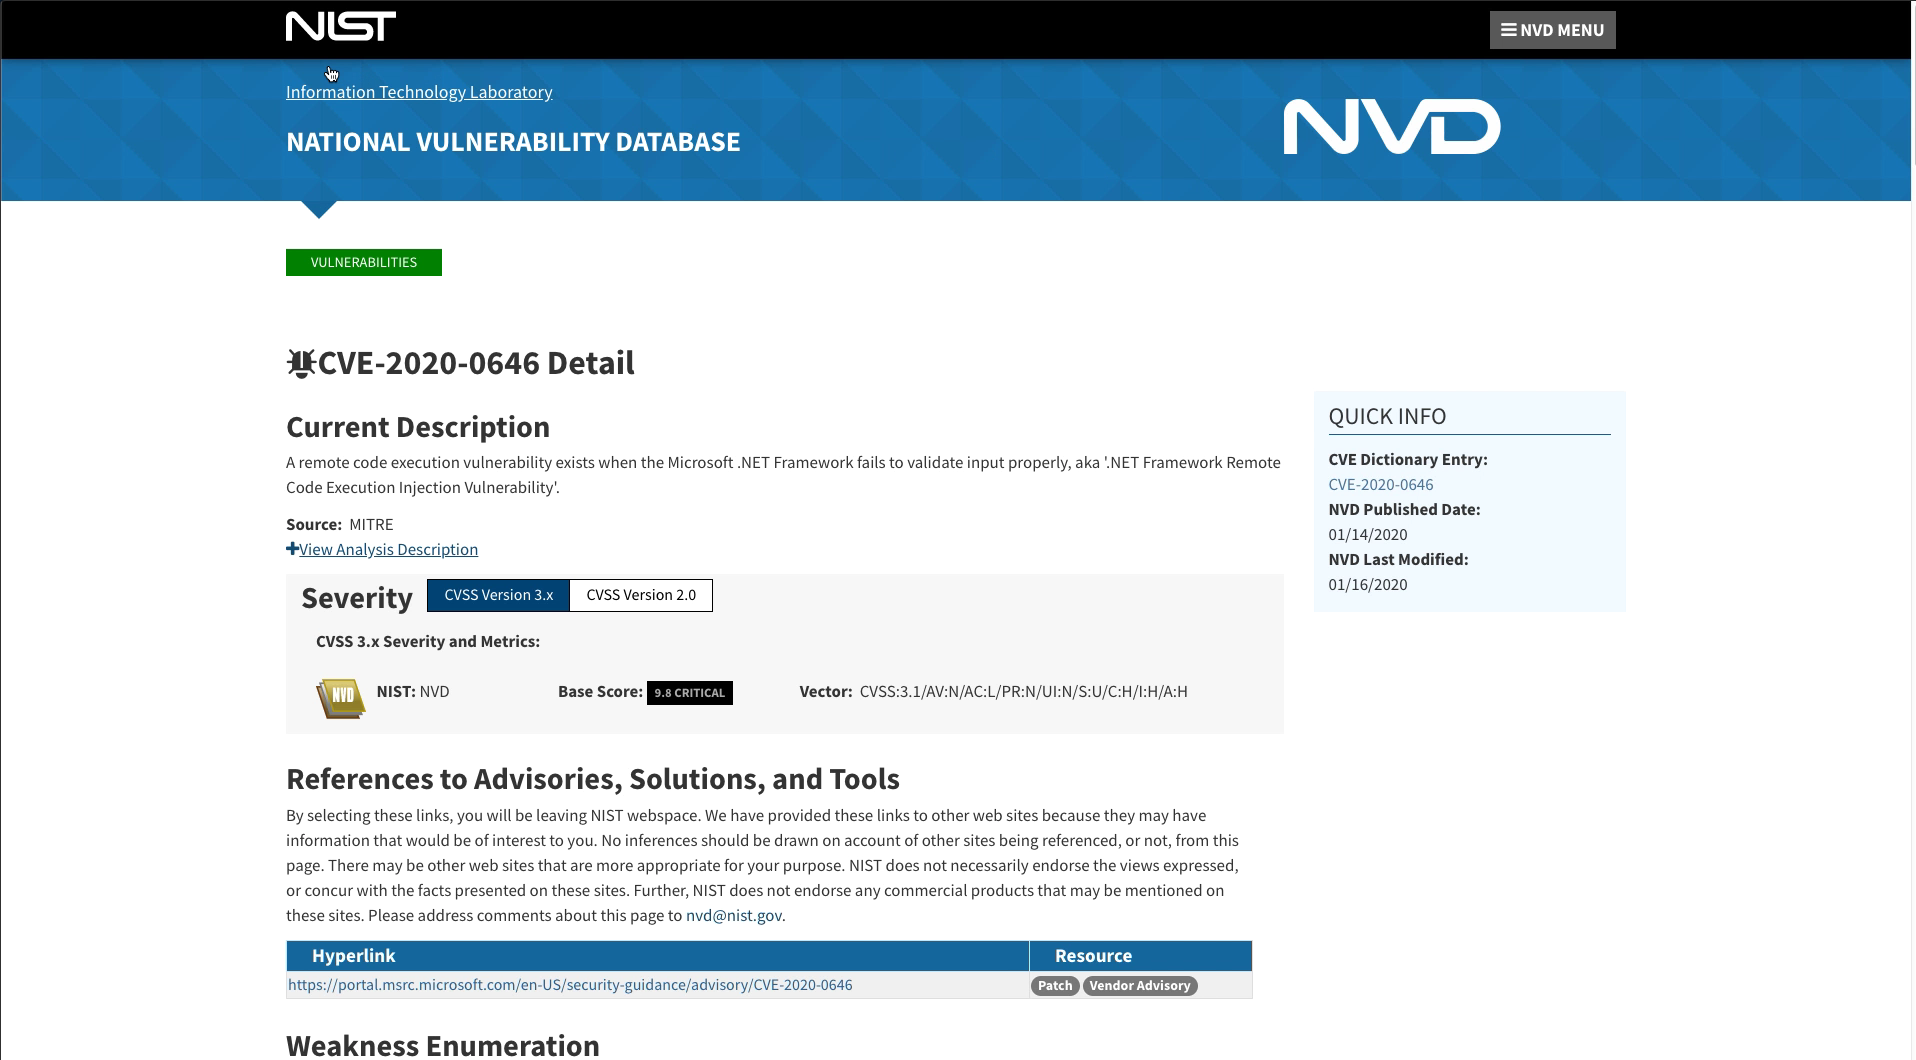
Go back to the CVEs tab and click on one of the CVEs. This will launch a web browser to the NIST National Vulnerability Database which includes all of the details about the vulnerability.
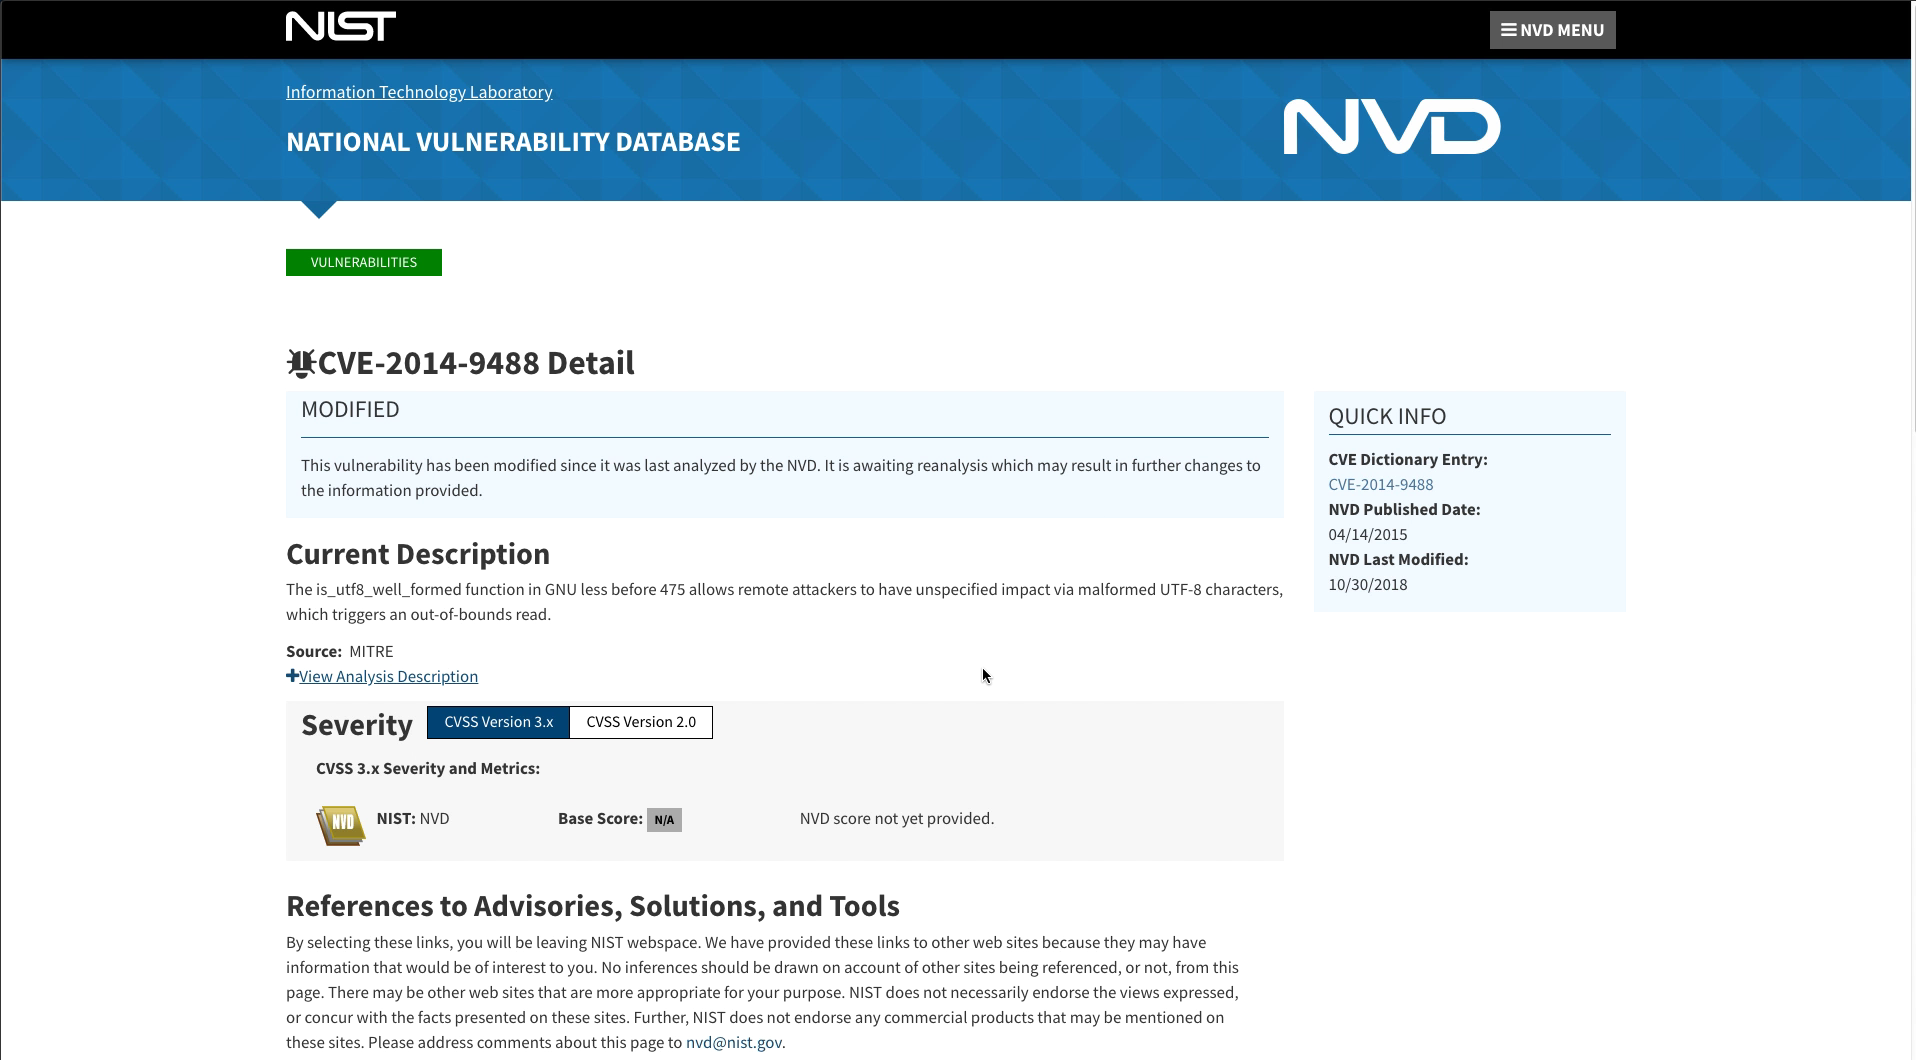
Clicking a CVE will launch a web page similar to the one below.
It is also possible to filter to a specific application in the vulnerability dashboard by changing the Scope. Change the scope to the nopCommerce application.
Click on the Remotely Exploitable Low Complexity indicator on the dashboard. A list of CVEs will be shown below.
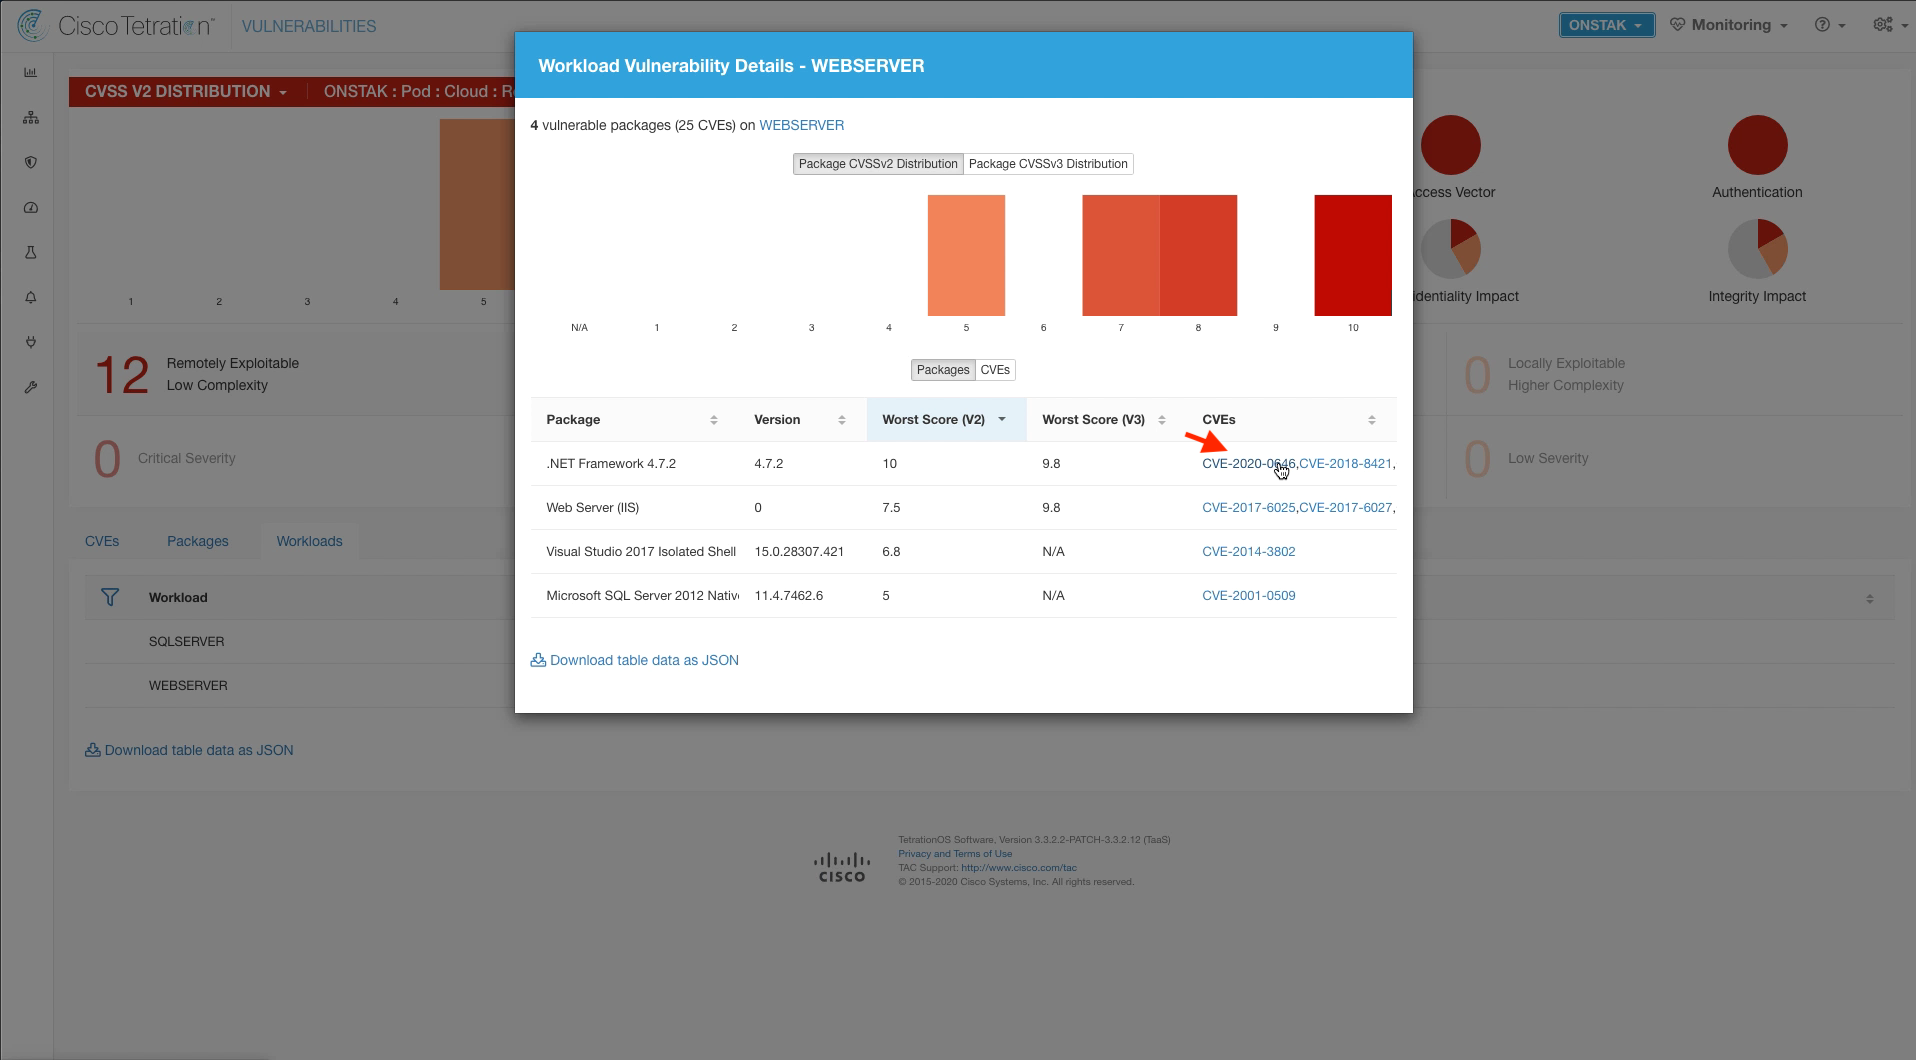
Click on the Workloads tab, and then click on the IIS web server.
Click on one of the CVEs on the Workload Vulnerability Details screen. This will once again open a browser to the National Vulnerability Database for the specific details on the vulnerability.
A page such as the one shown below will be displayed.
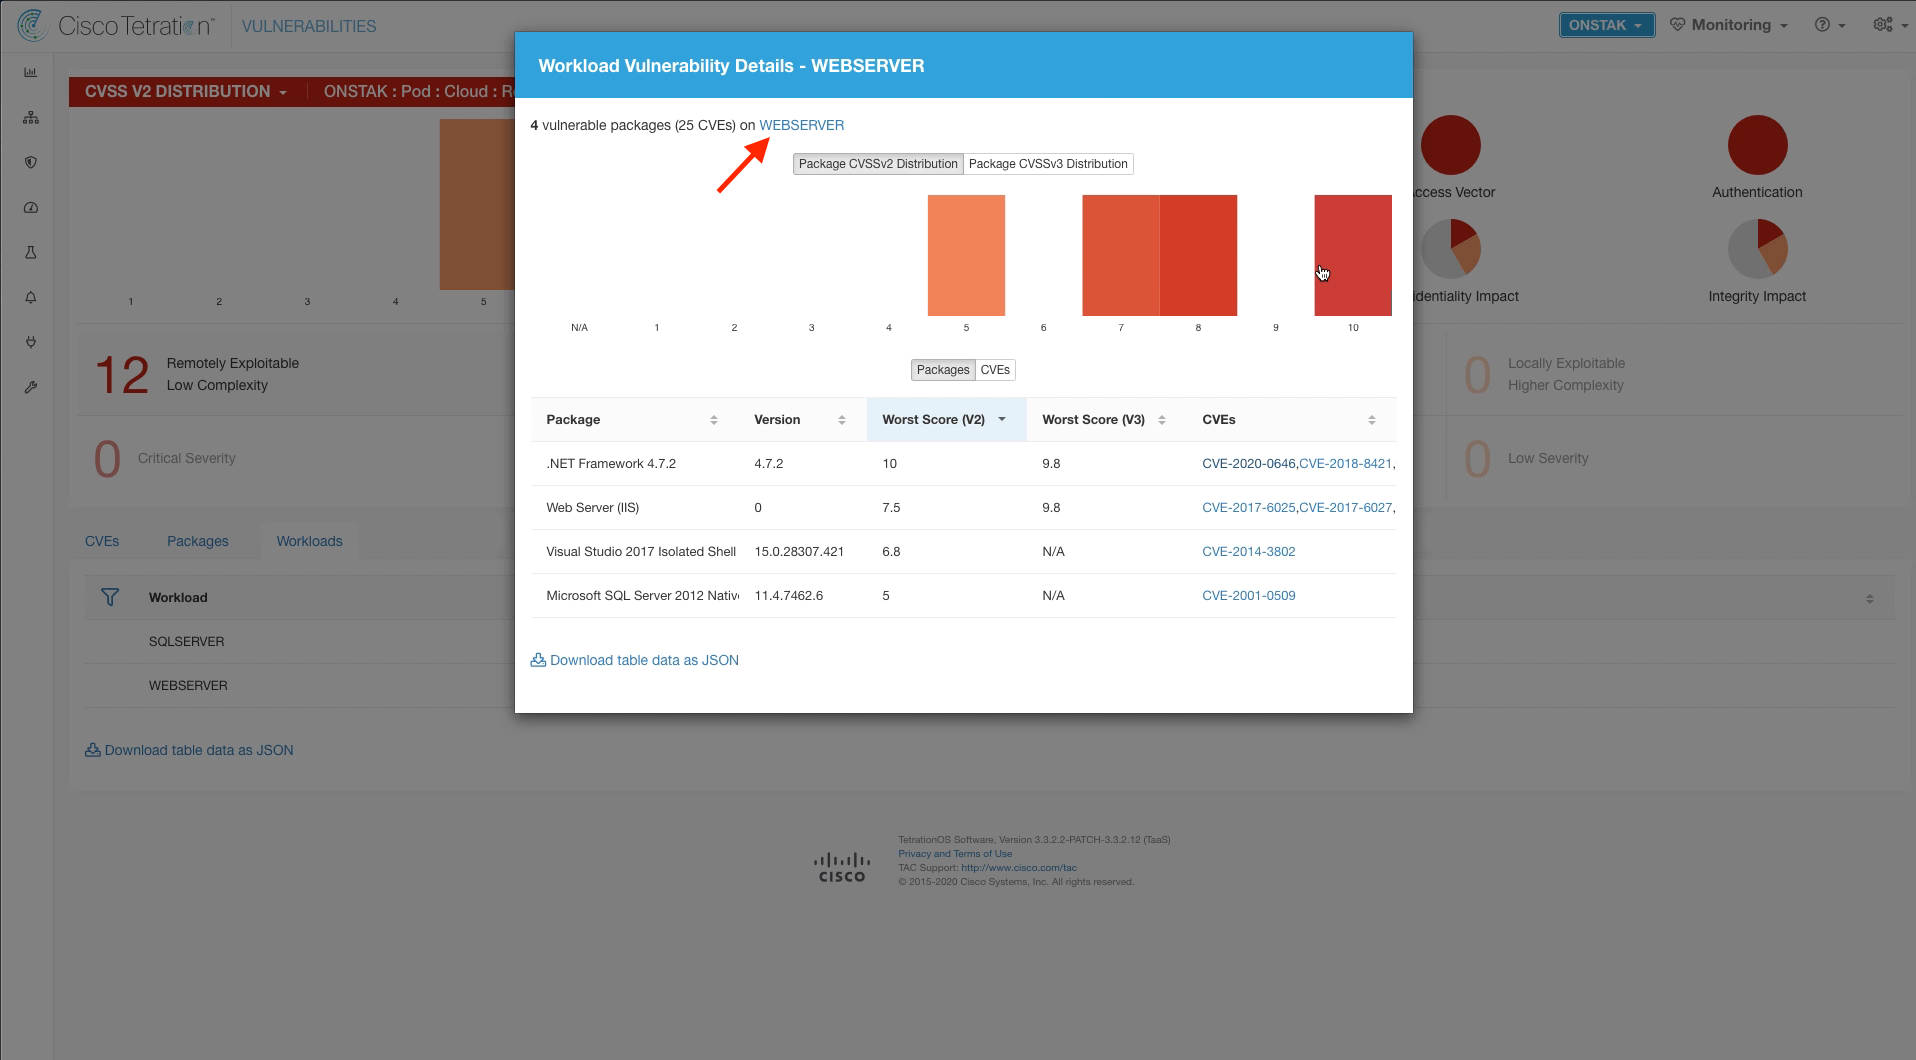
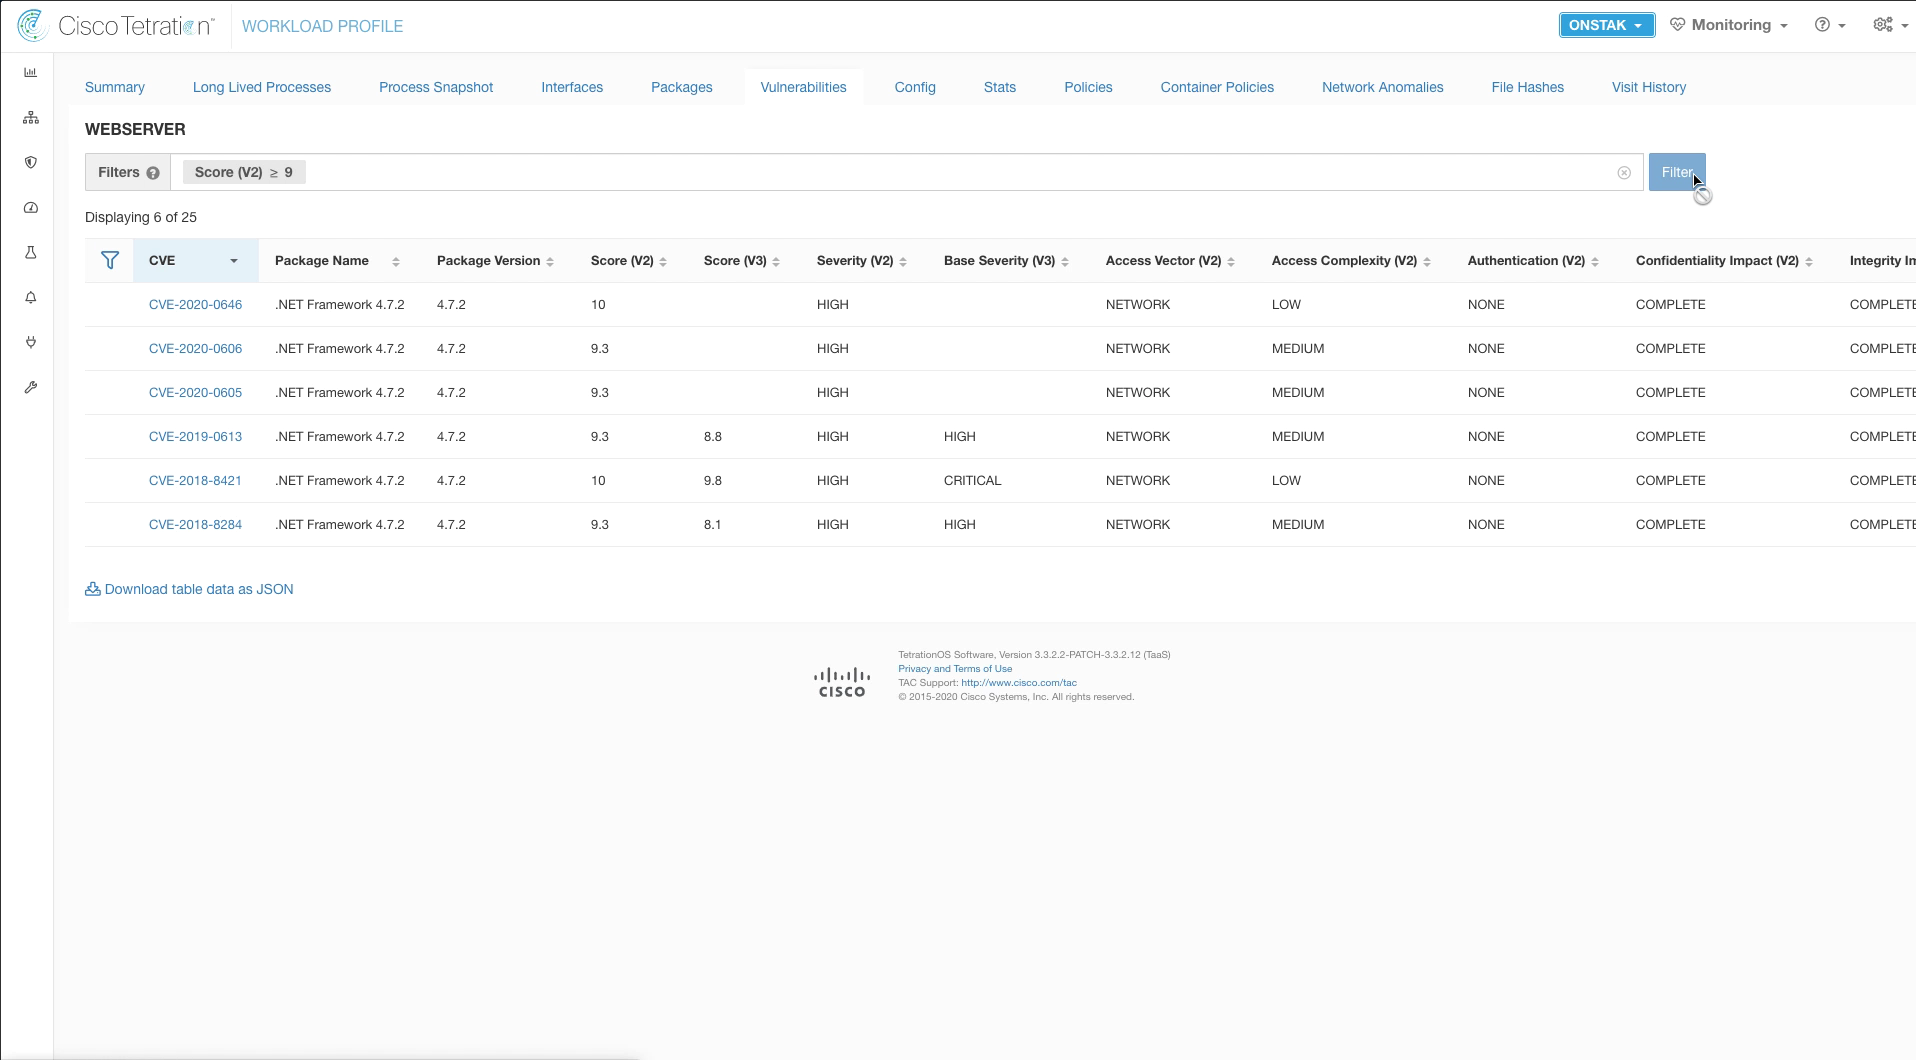
Click on the link to the IIS web server at the top of the Workload Vulnerability Details screen. This launches into the Workload Profile Vulnerabilities tab.
Here you can view all of the vulnerabilities associated with the server, and can filter the output based on many factors including severity. Enter the filter Score (V2) >= 9 to view vulnerabilities with CVE score of 9 or above.
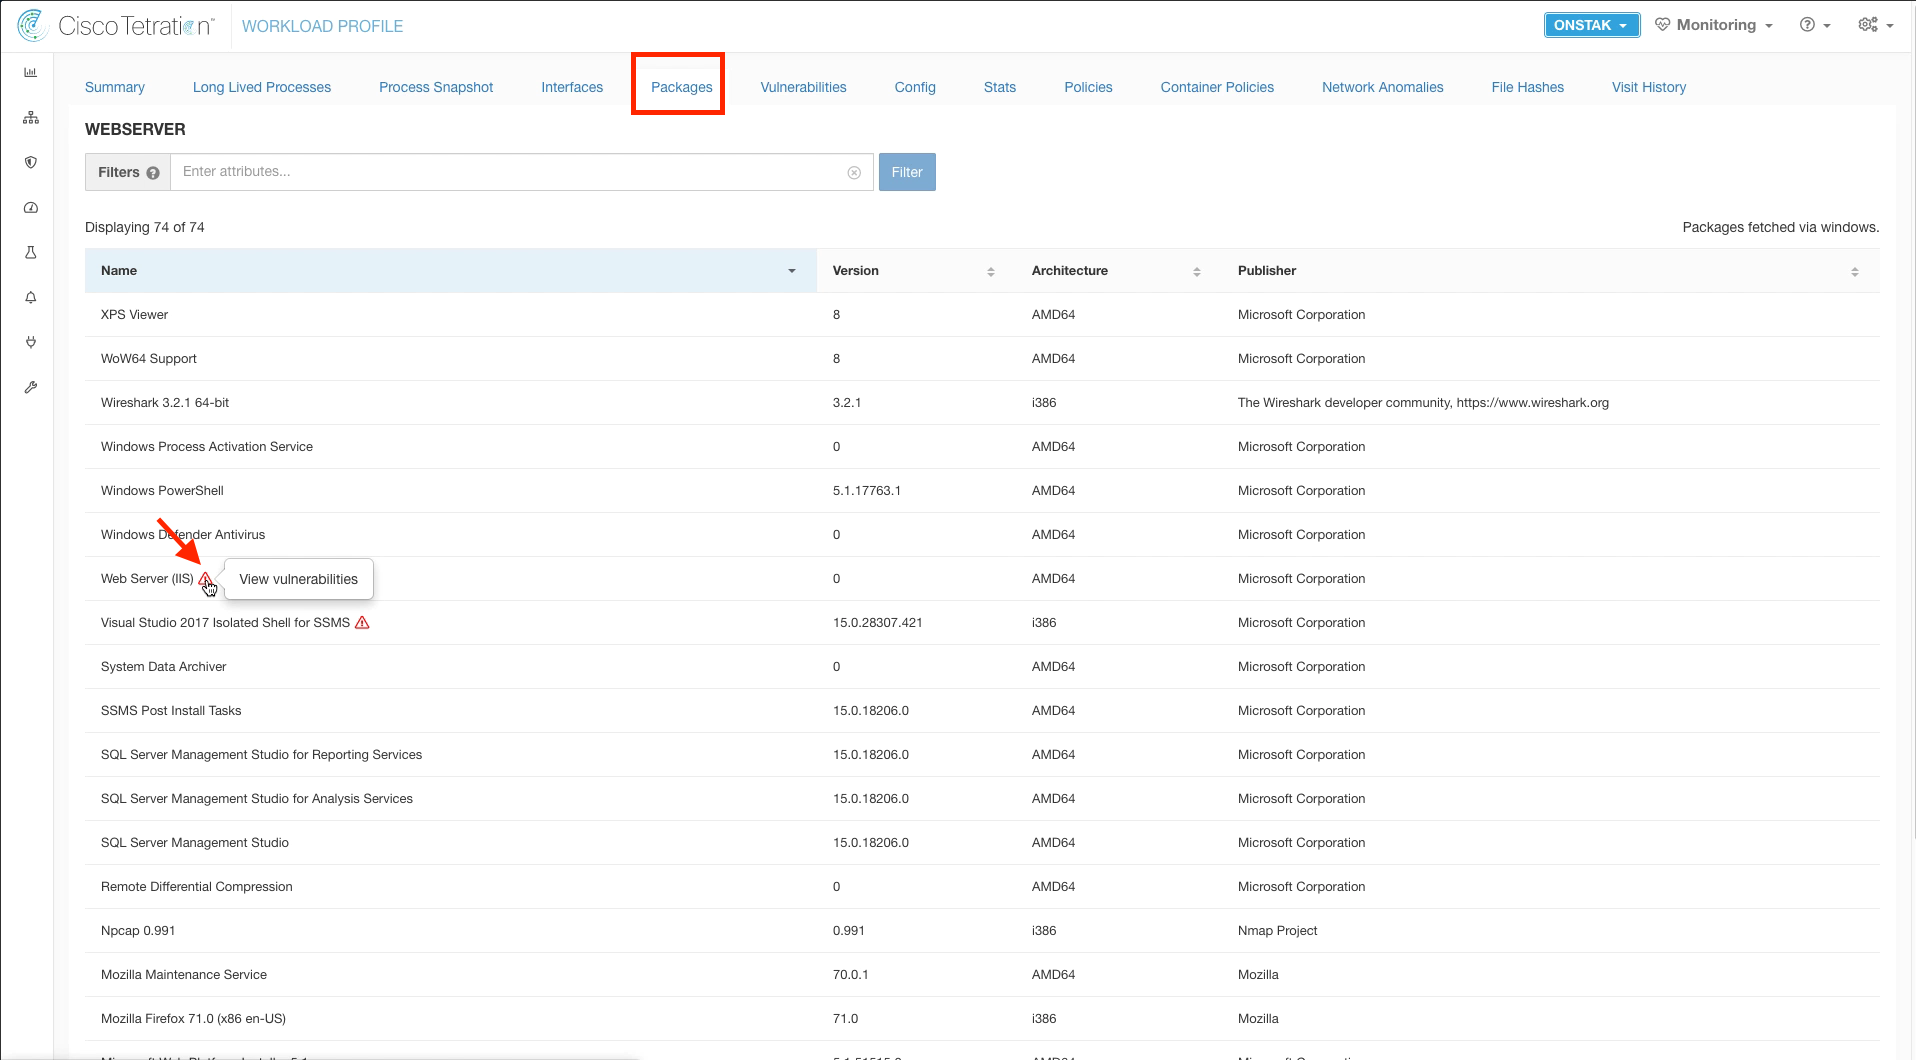
Click on the Packages tab. A list of all of the packages running on the machine is displayed. If a package has vulnerabilities, it will have a warning sign next to it and you can click on the warning sign to view the vulnerabilities for that package.
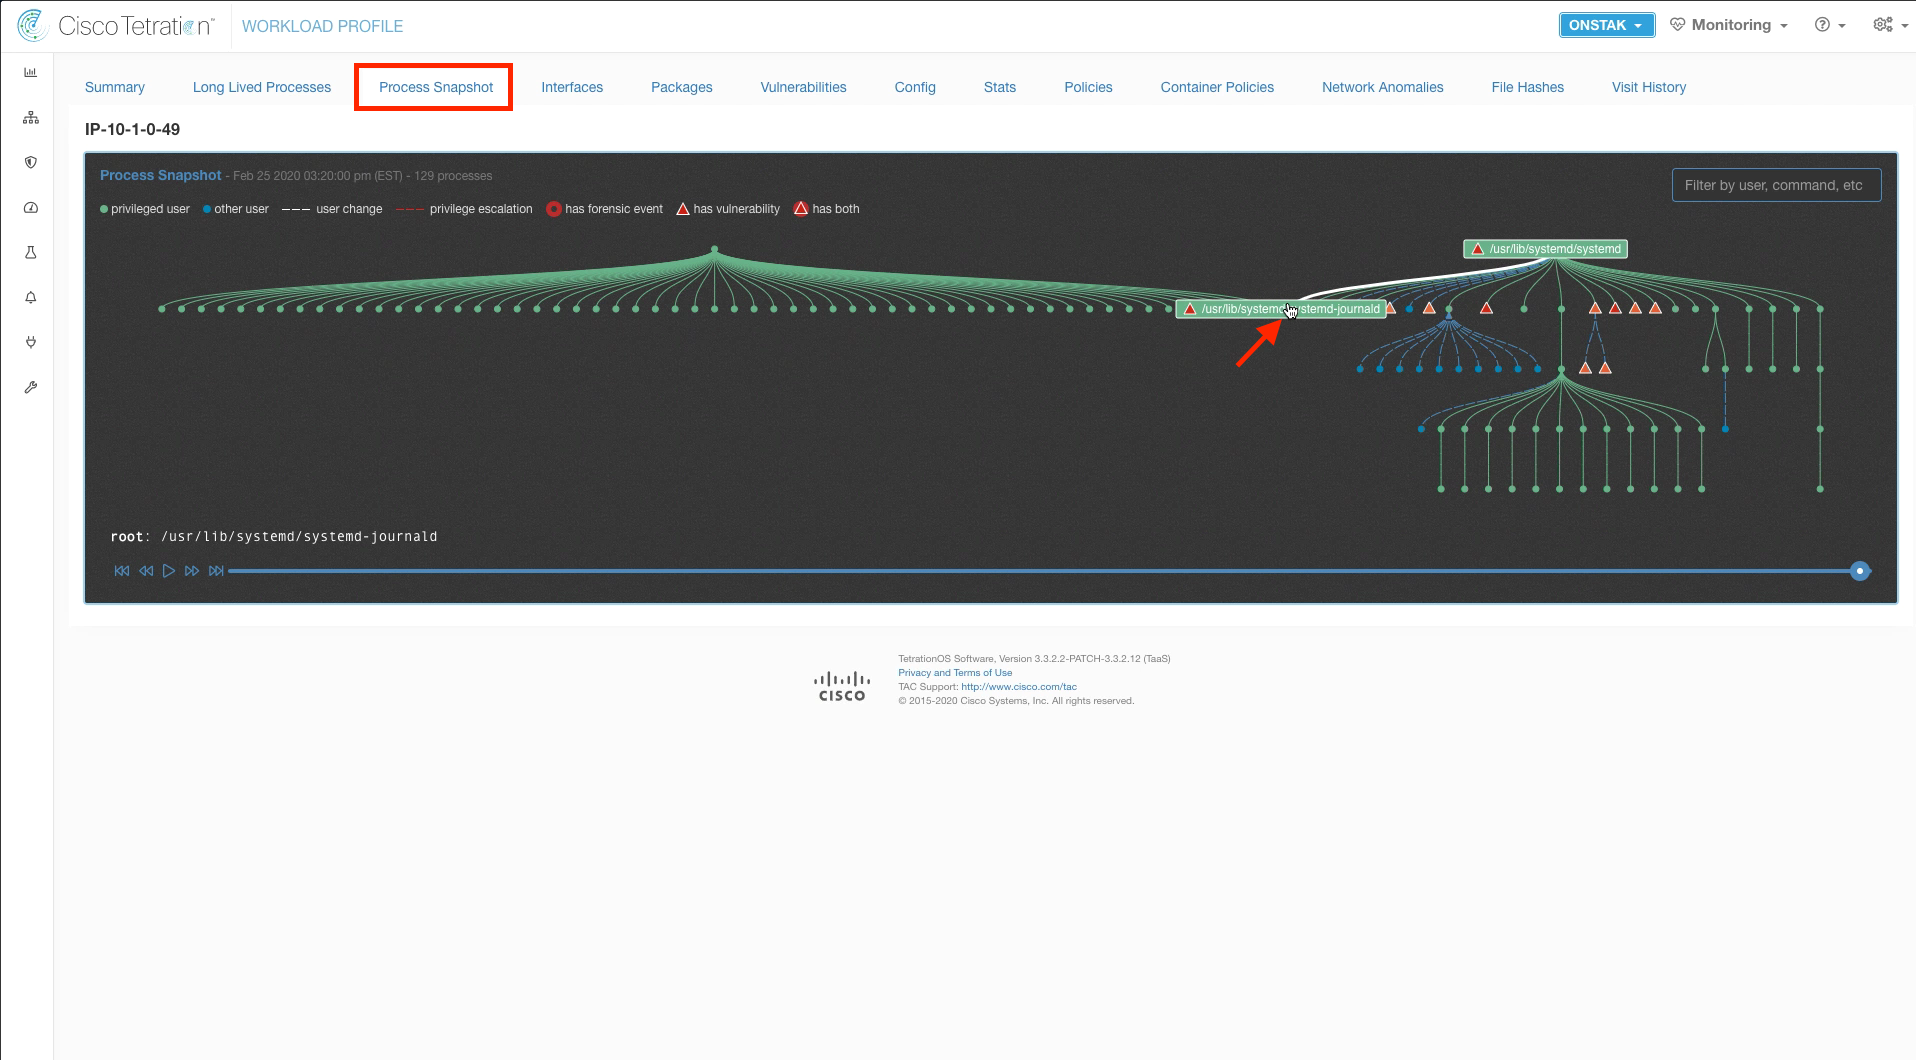
Click on the Process Snapshot tab. The process snapshot shows all of the processes that have been seen and that are currently running on the machine. It displays processes launched as regular users as well as those launched by privileged users. Hover your mouse over the dots to view the processes.
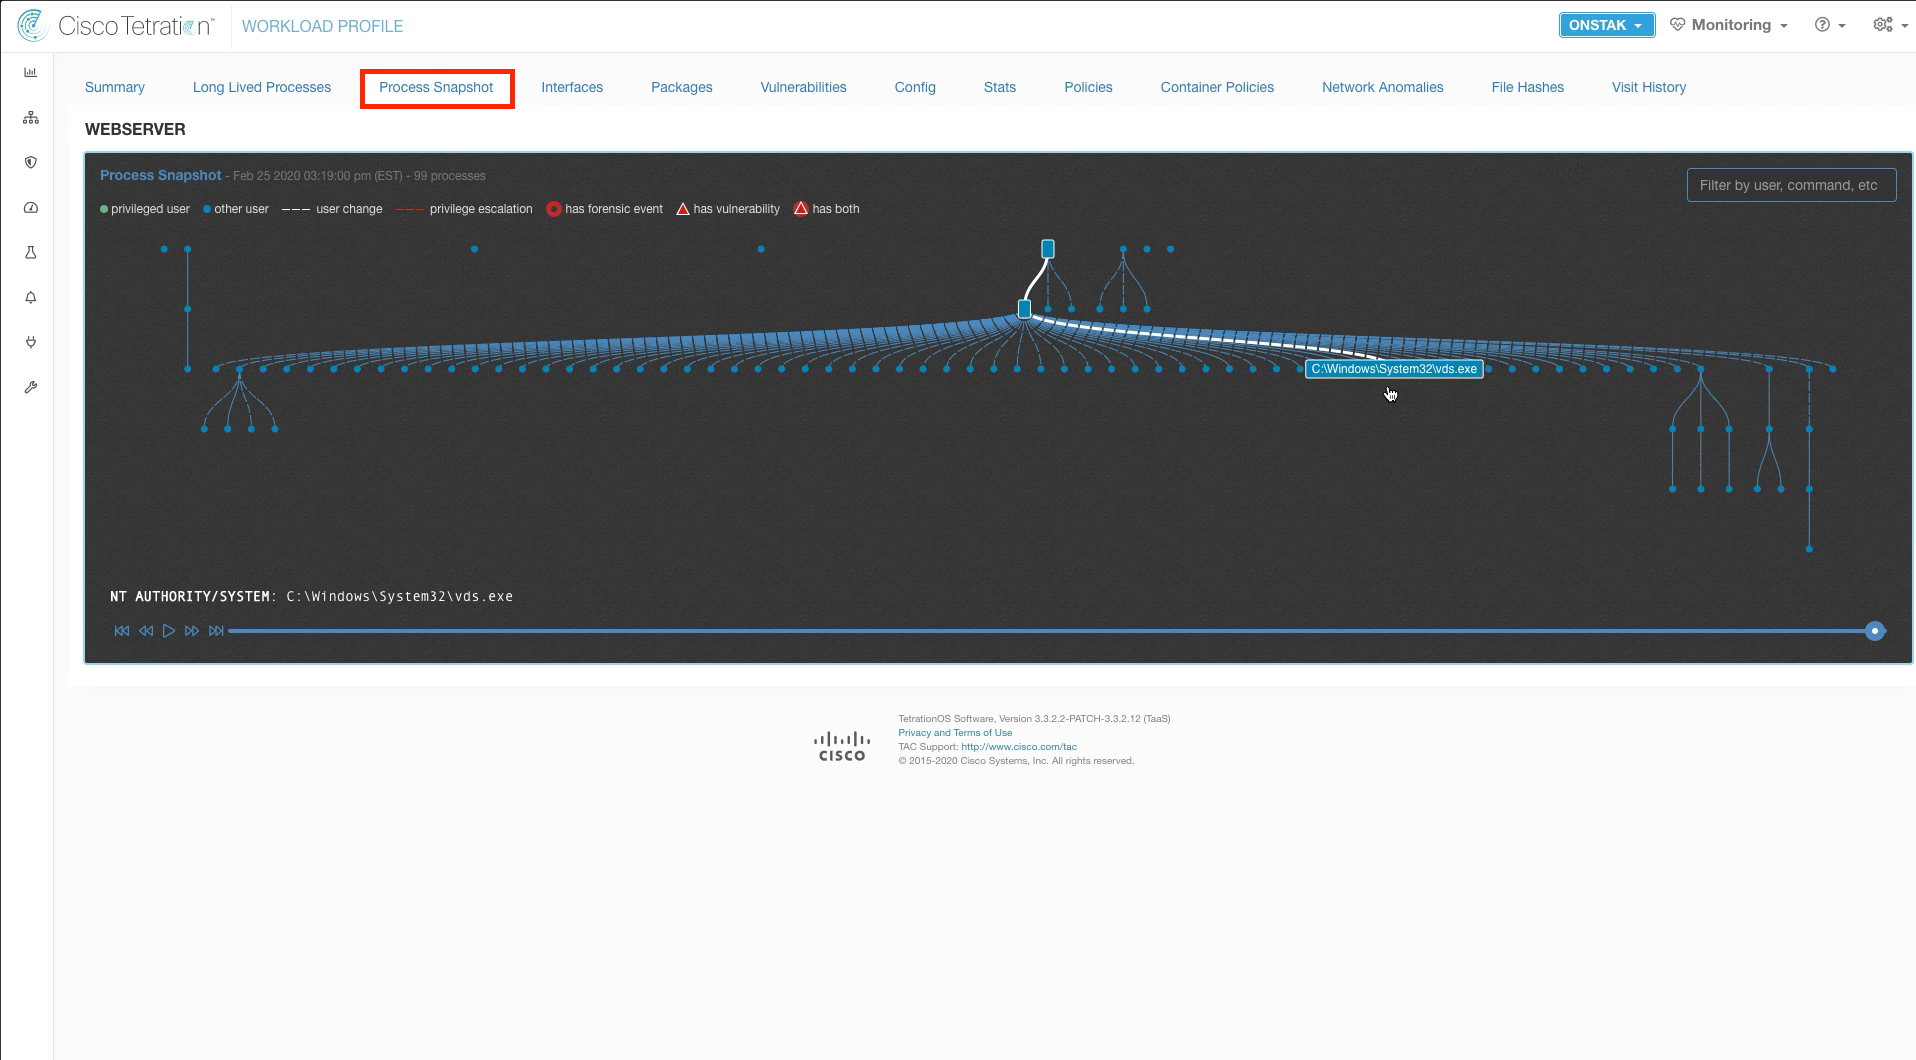
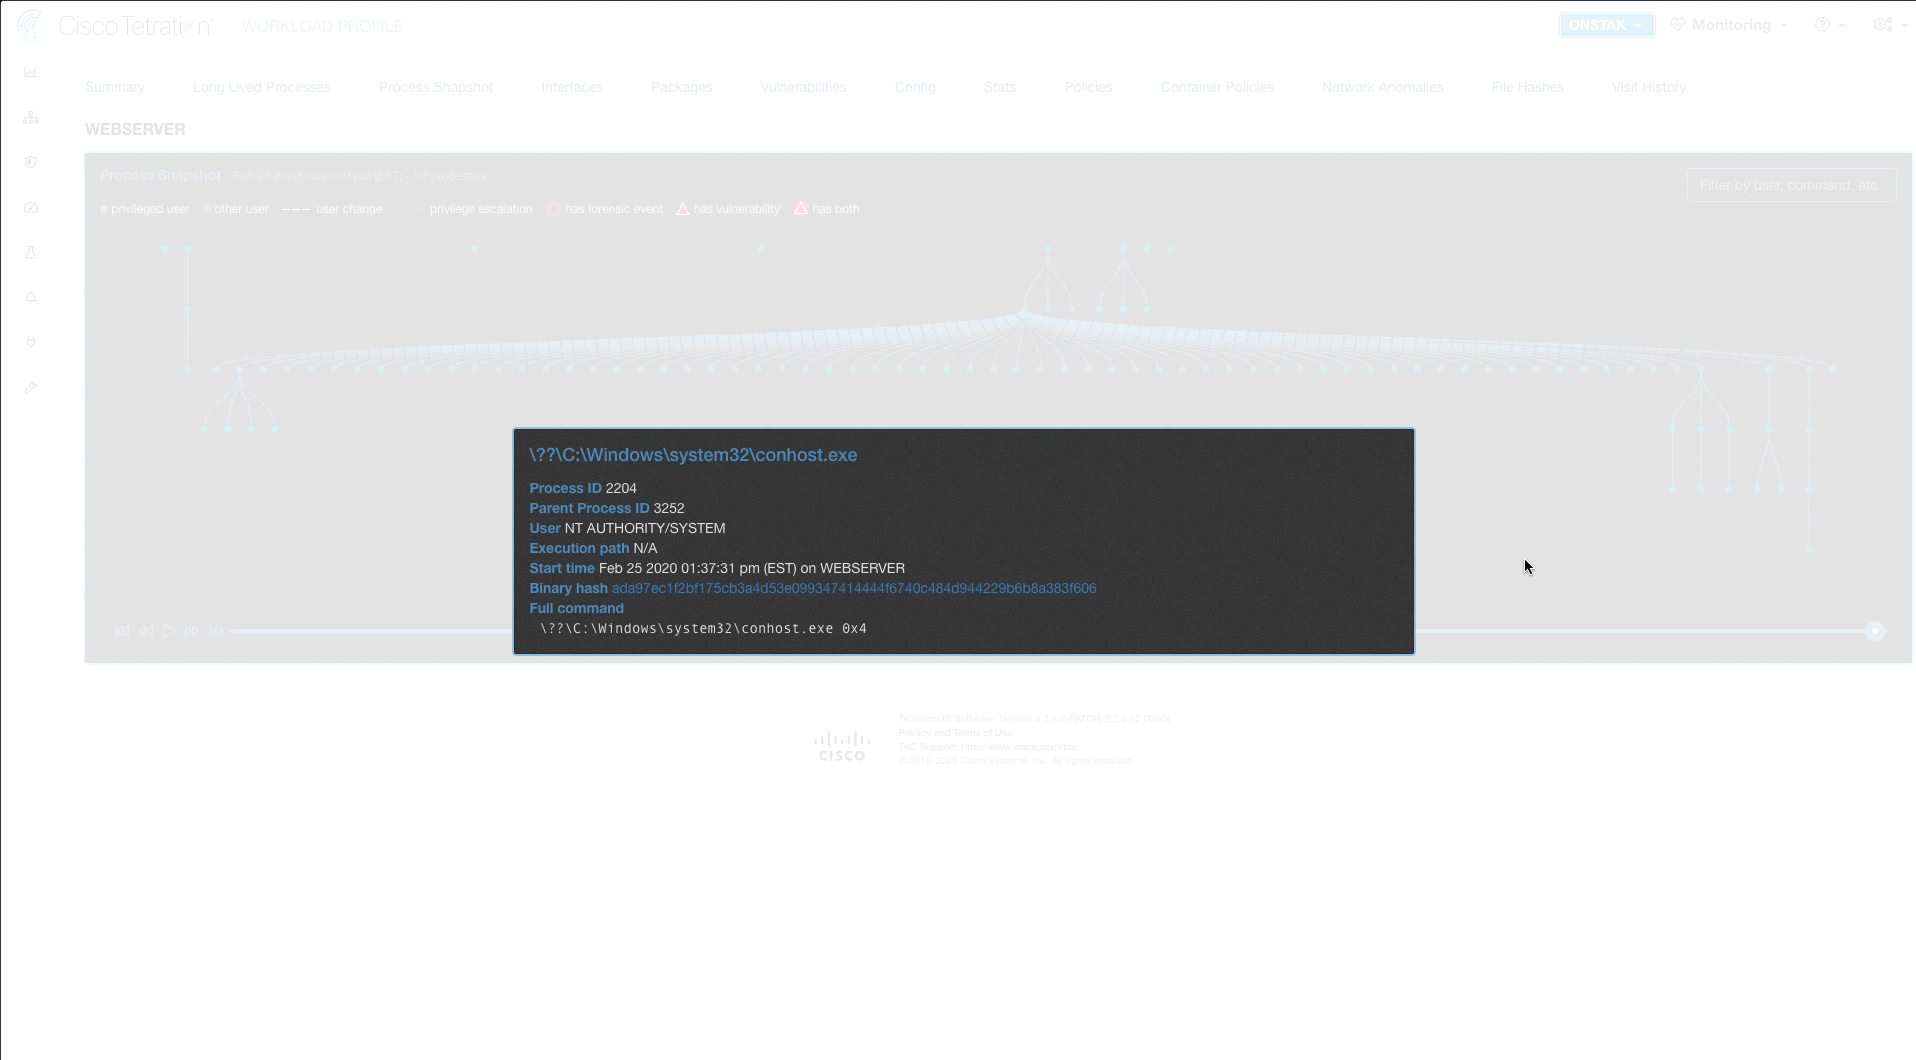
You can also get more details about a process by clicking on it. Click on a process to view the details.
Navigate to the Vulnerability Dashboard.
Change the Scope to OpenCart.
Click on the Workloads tab, and then click on the Apache web server.
Click on the link to the Apache web server.
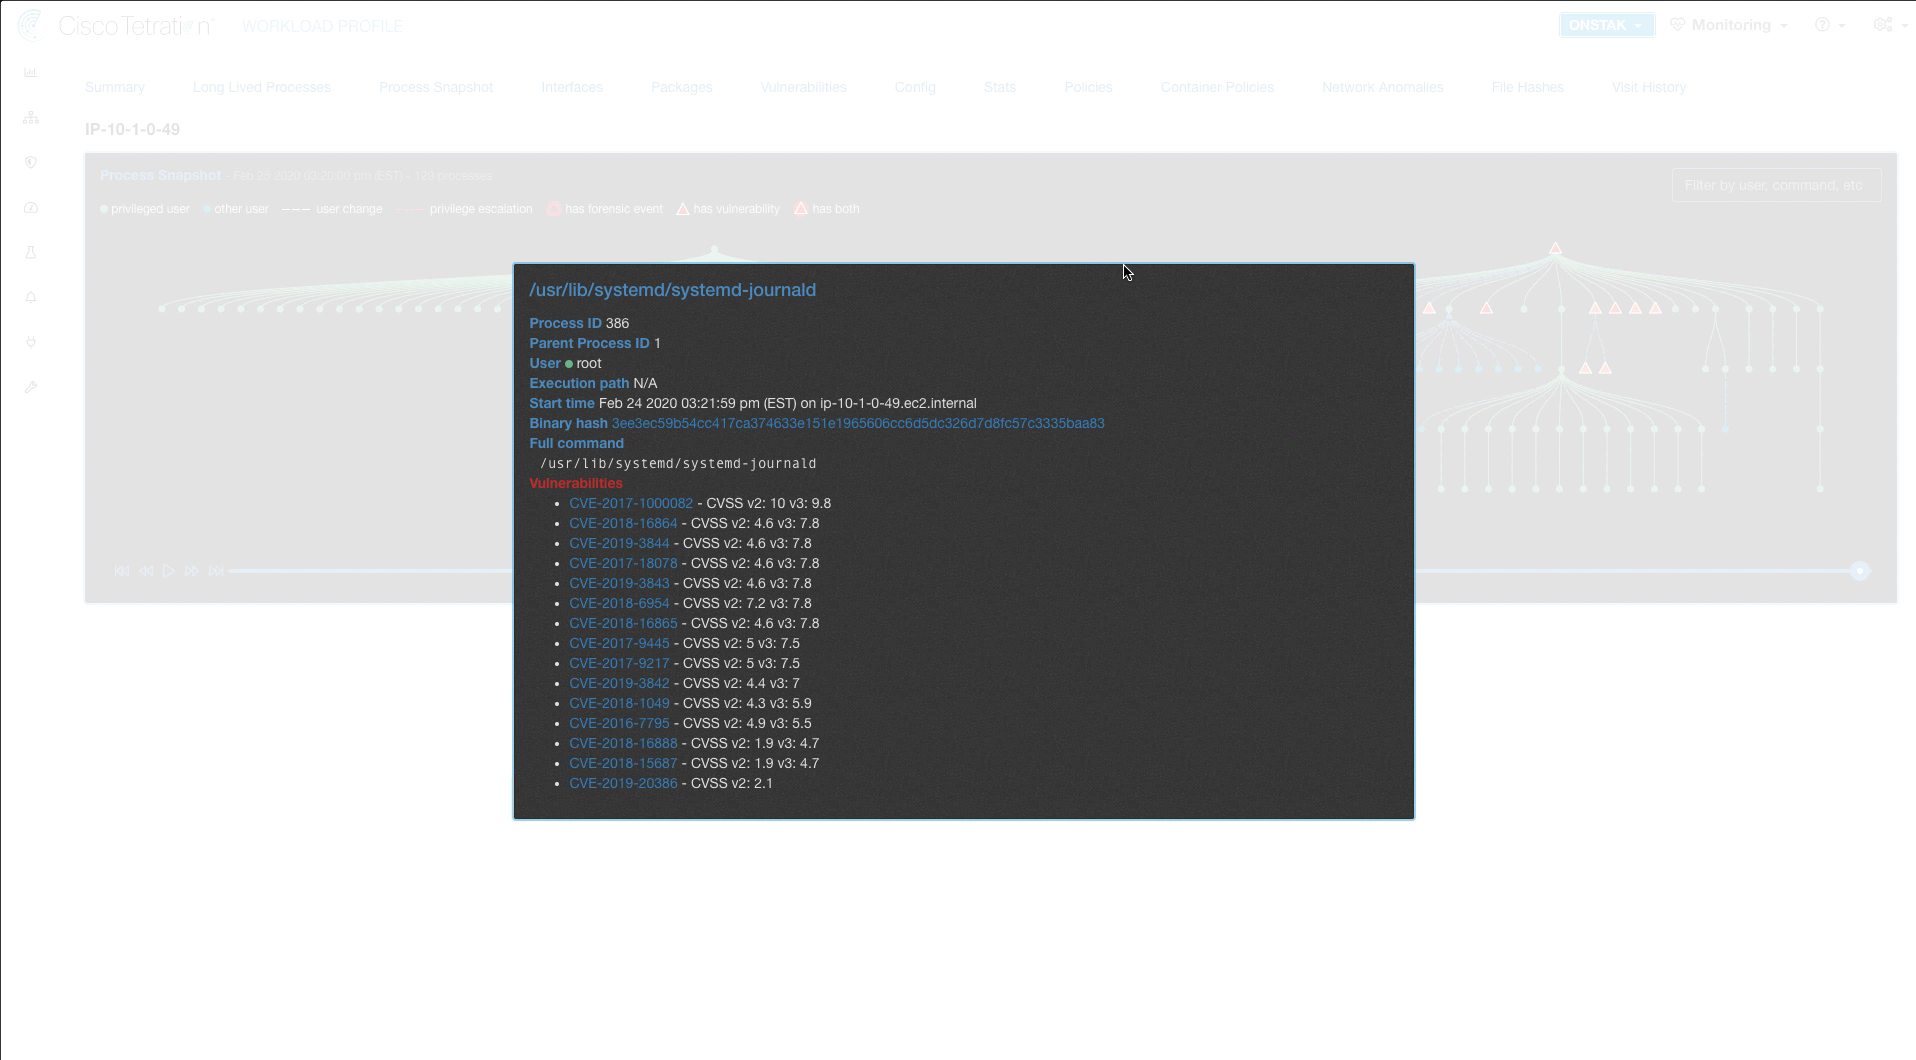
Click on the Process Snapshot tab. Several of the processes on the Apache web server have vulnerabilities, which are shown on the process tree with an orange triangle. Click on one of the vulnerabilities.
Clicking on a vulnerable process shows the process details, along with the links to the vulnerabilities in the CVE database.
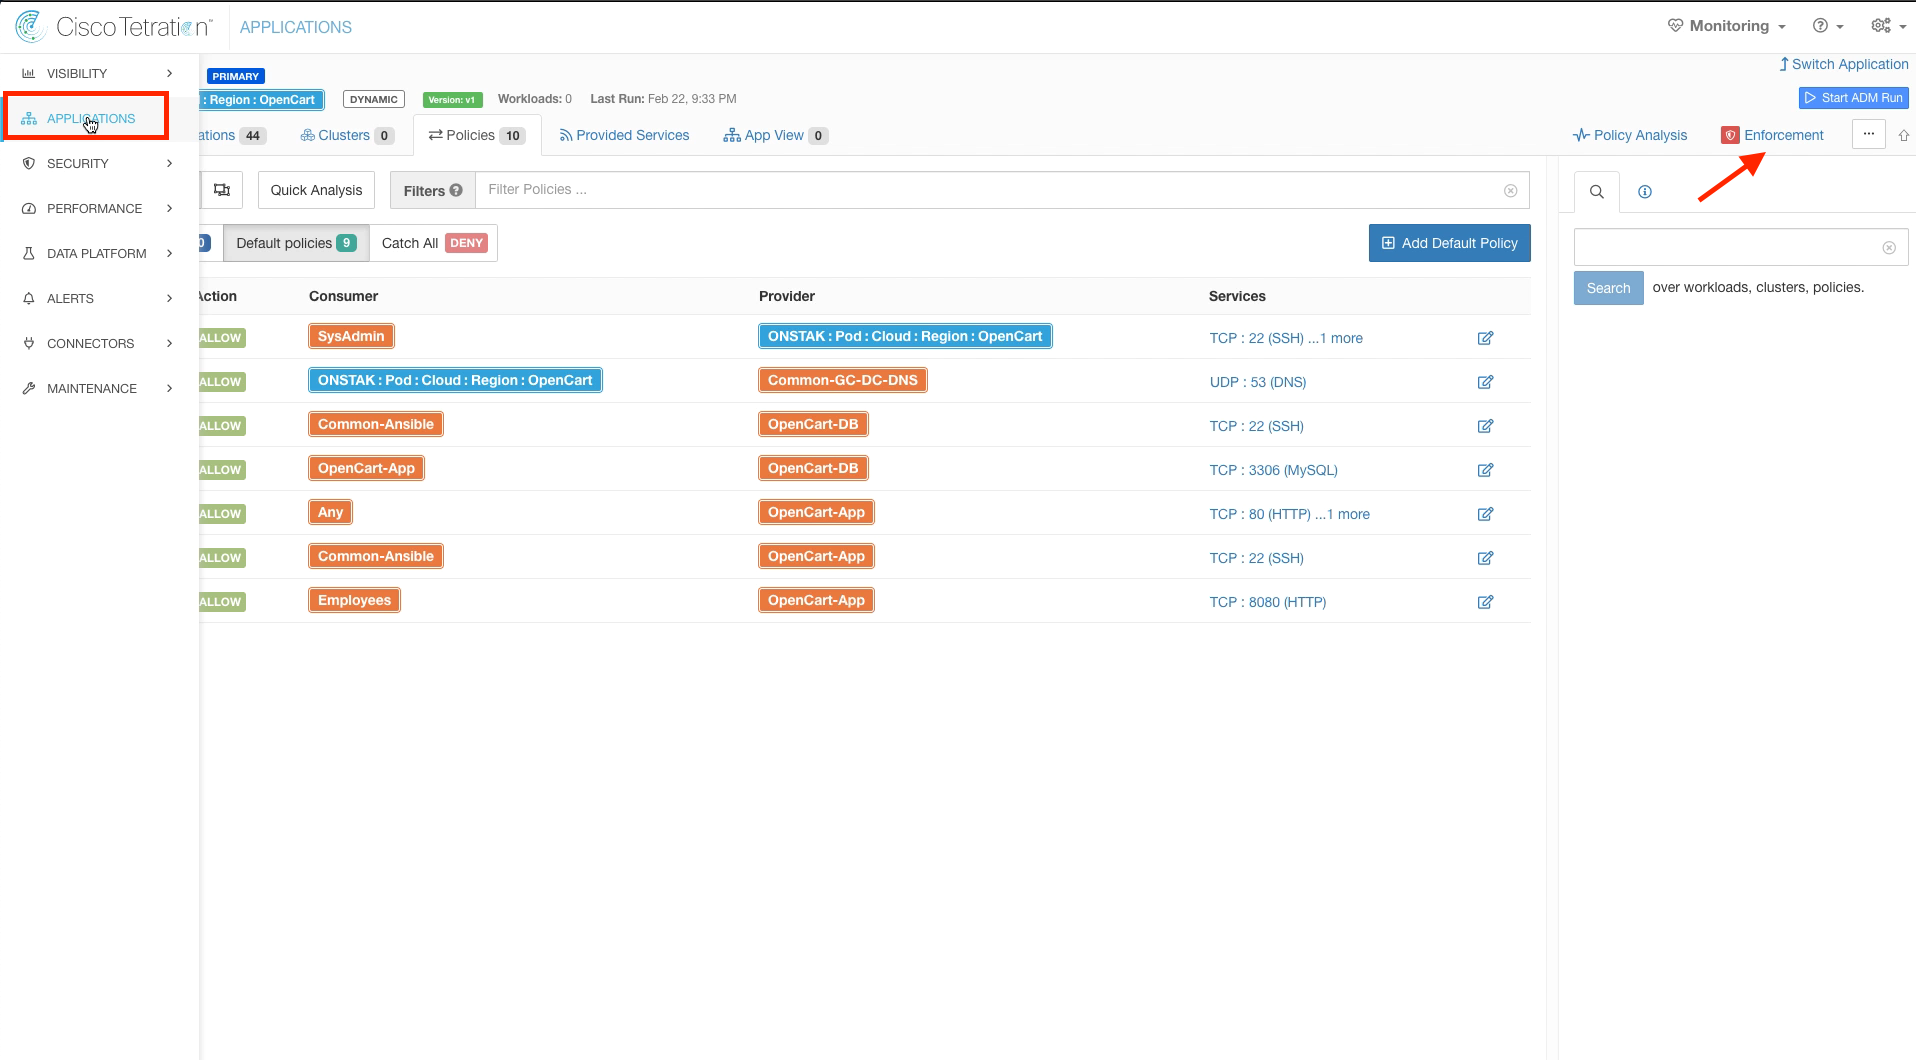
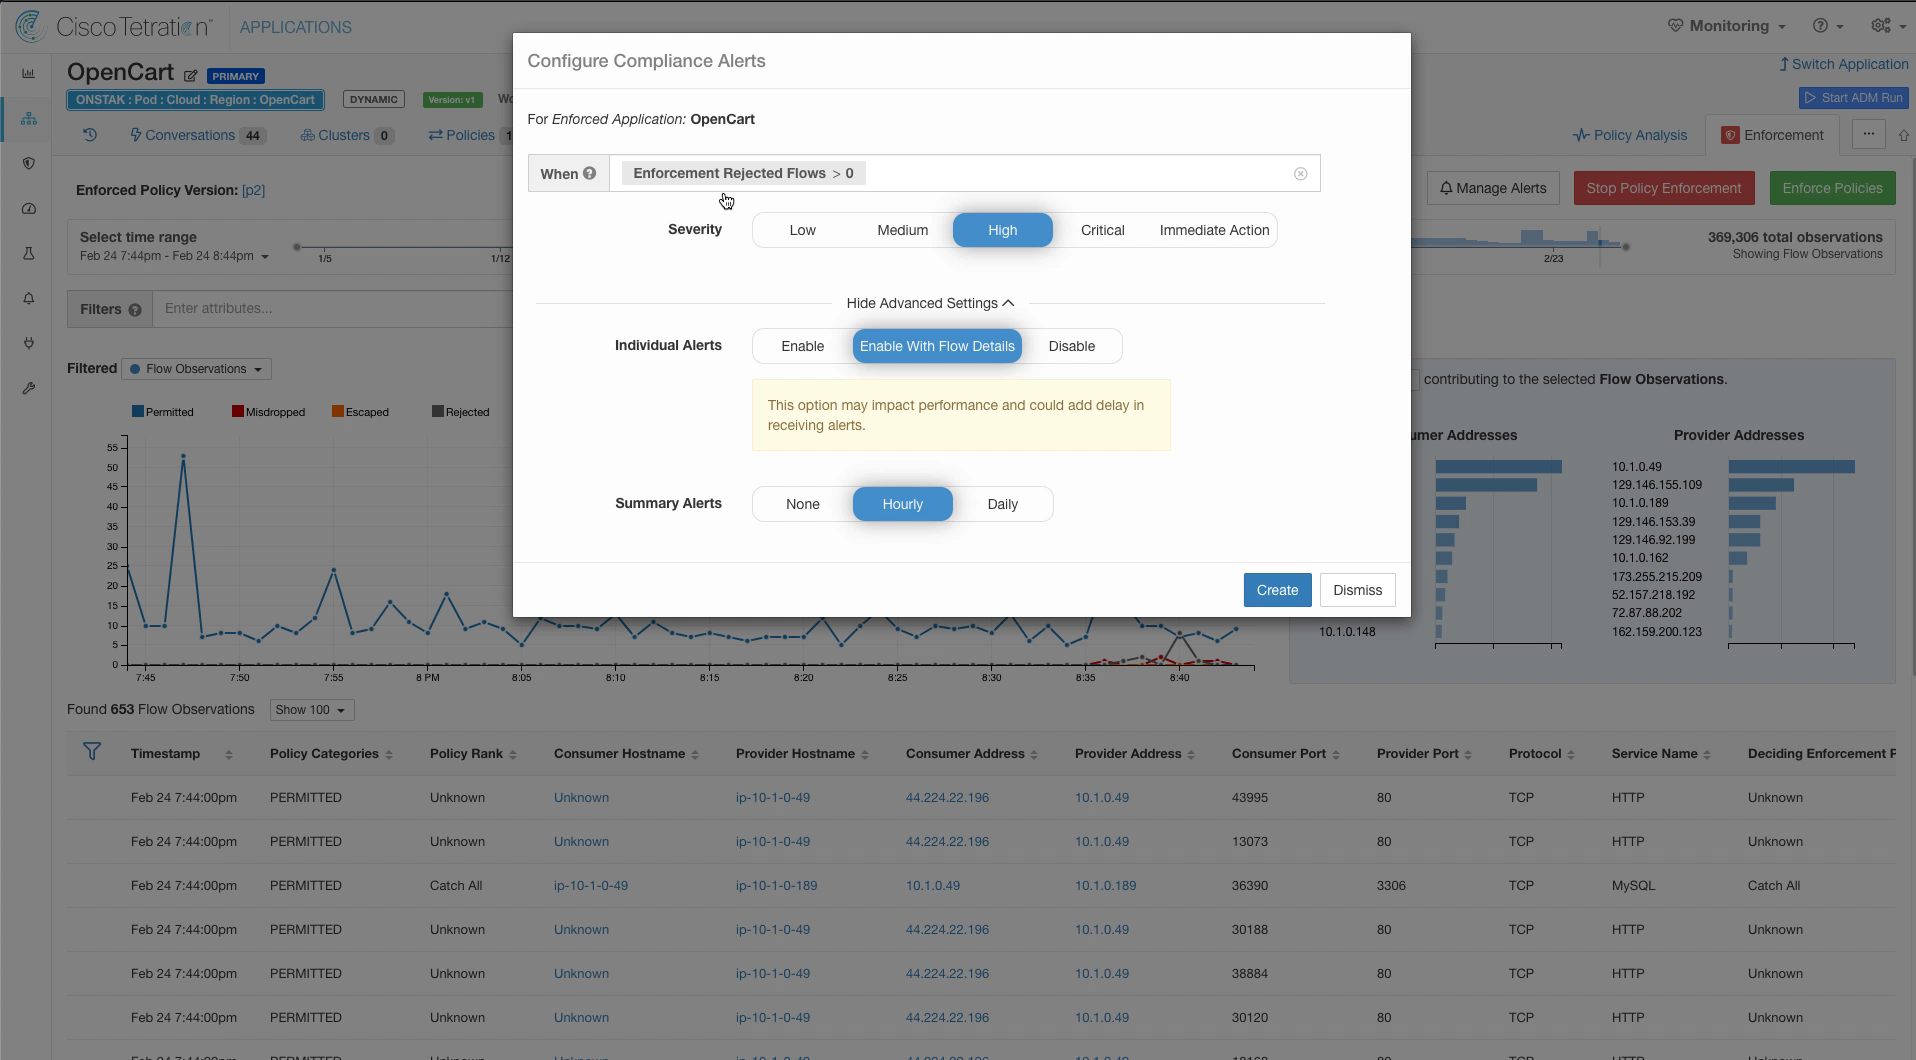
Next we will explore the ability of Tetration to send notifications upon detected events. Navigate to Application Workspaces and select any application workspace. Then click on the Enforcement tab.
Click on Manage Alerts.
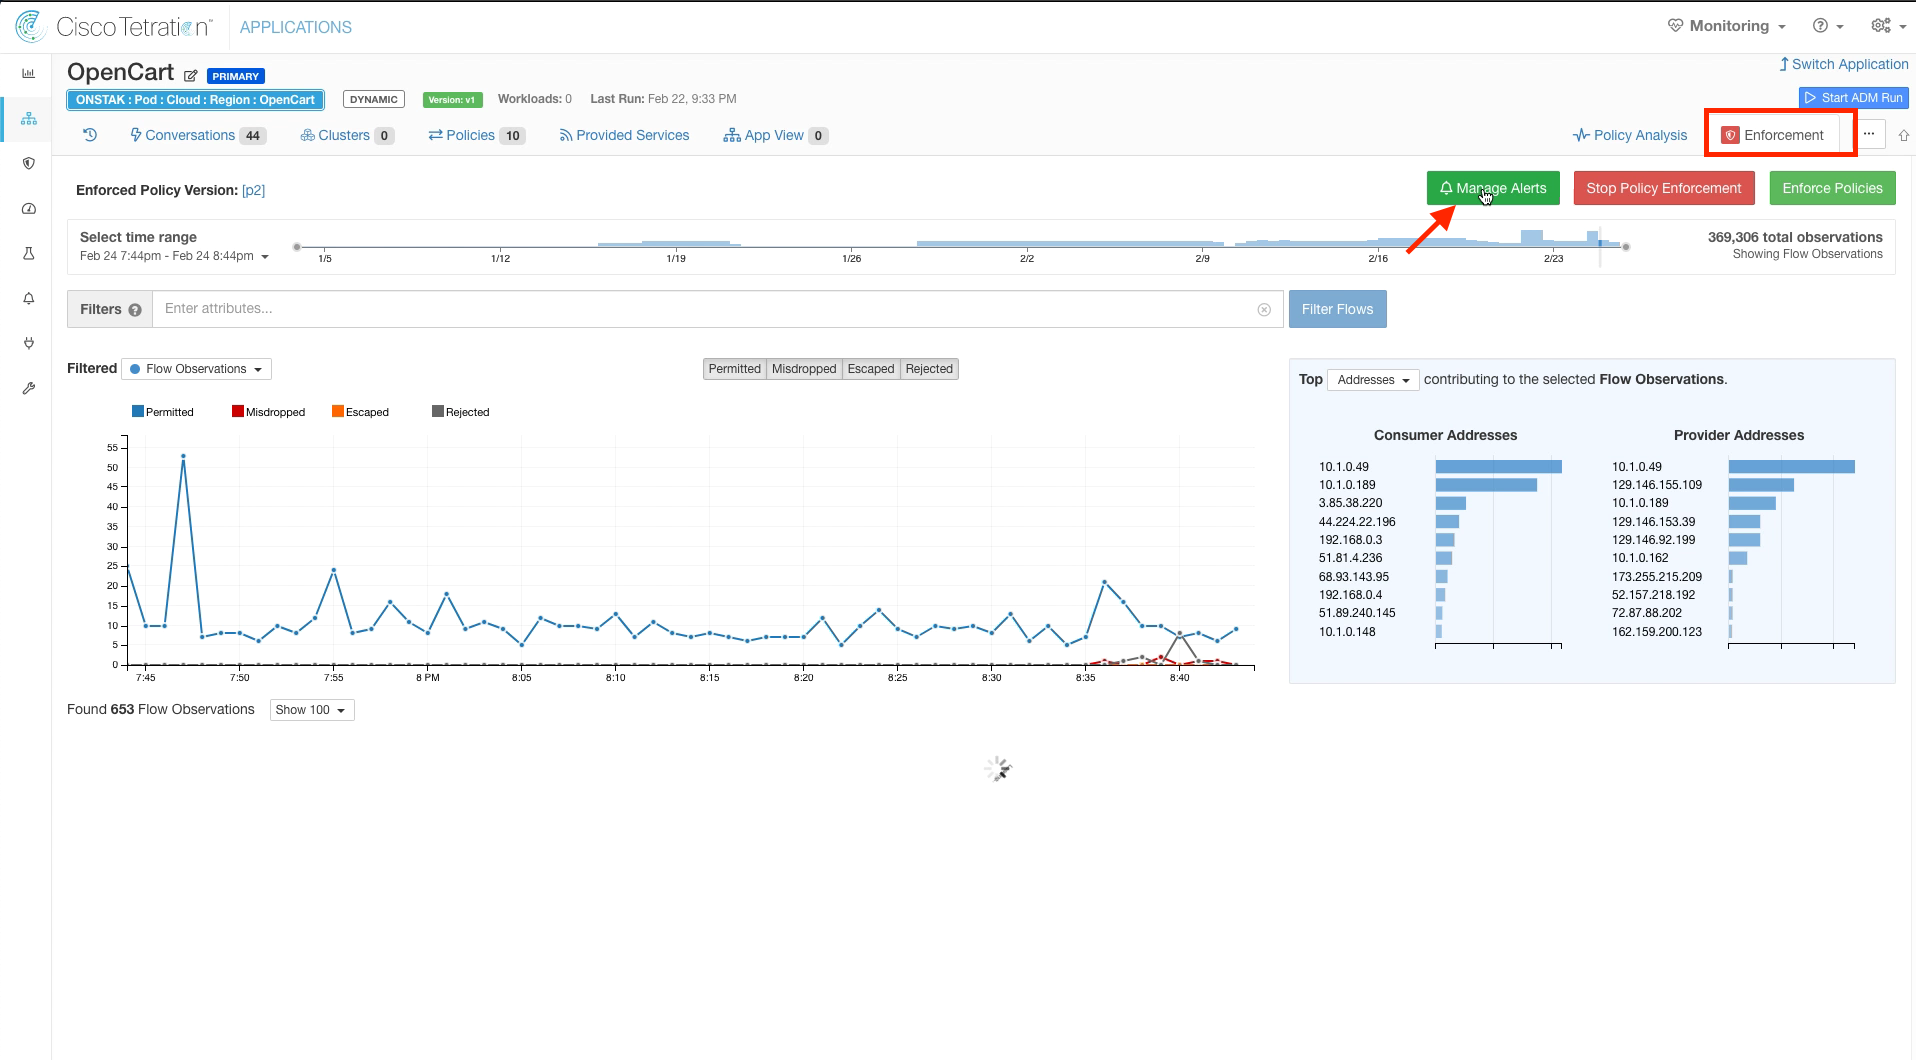
Here we can configure alerts to be generated when Rejected flows exceed a specified threshold, or when Escaped or Misdropped flows are reported. Enter the criteria Enforcement Rejected Flows > 0 and set the Severity to High. Optionally, you can choose to receive flow details with the alerts and/or an hourly or daily summary of all alerts.
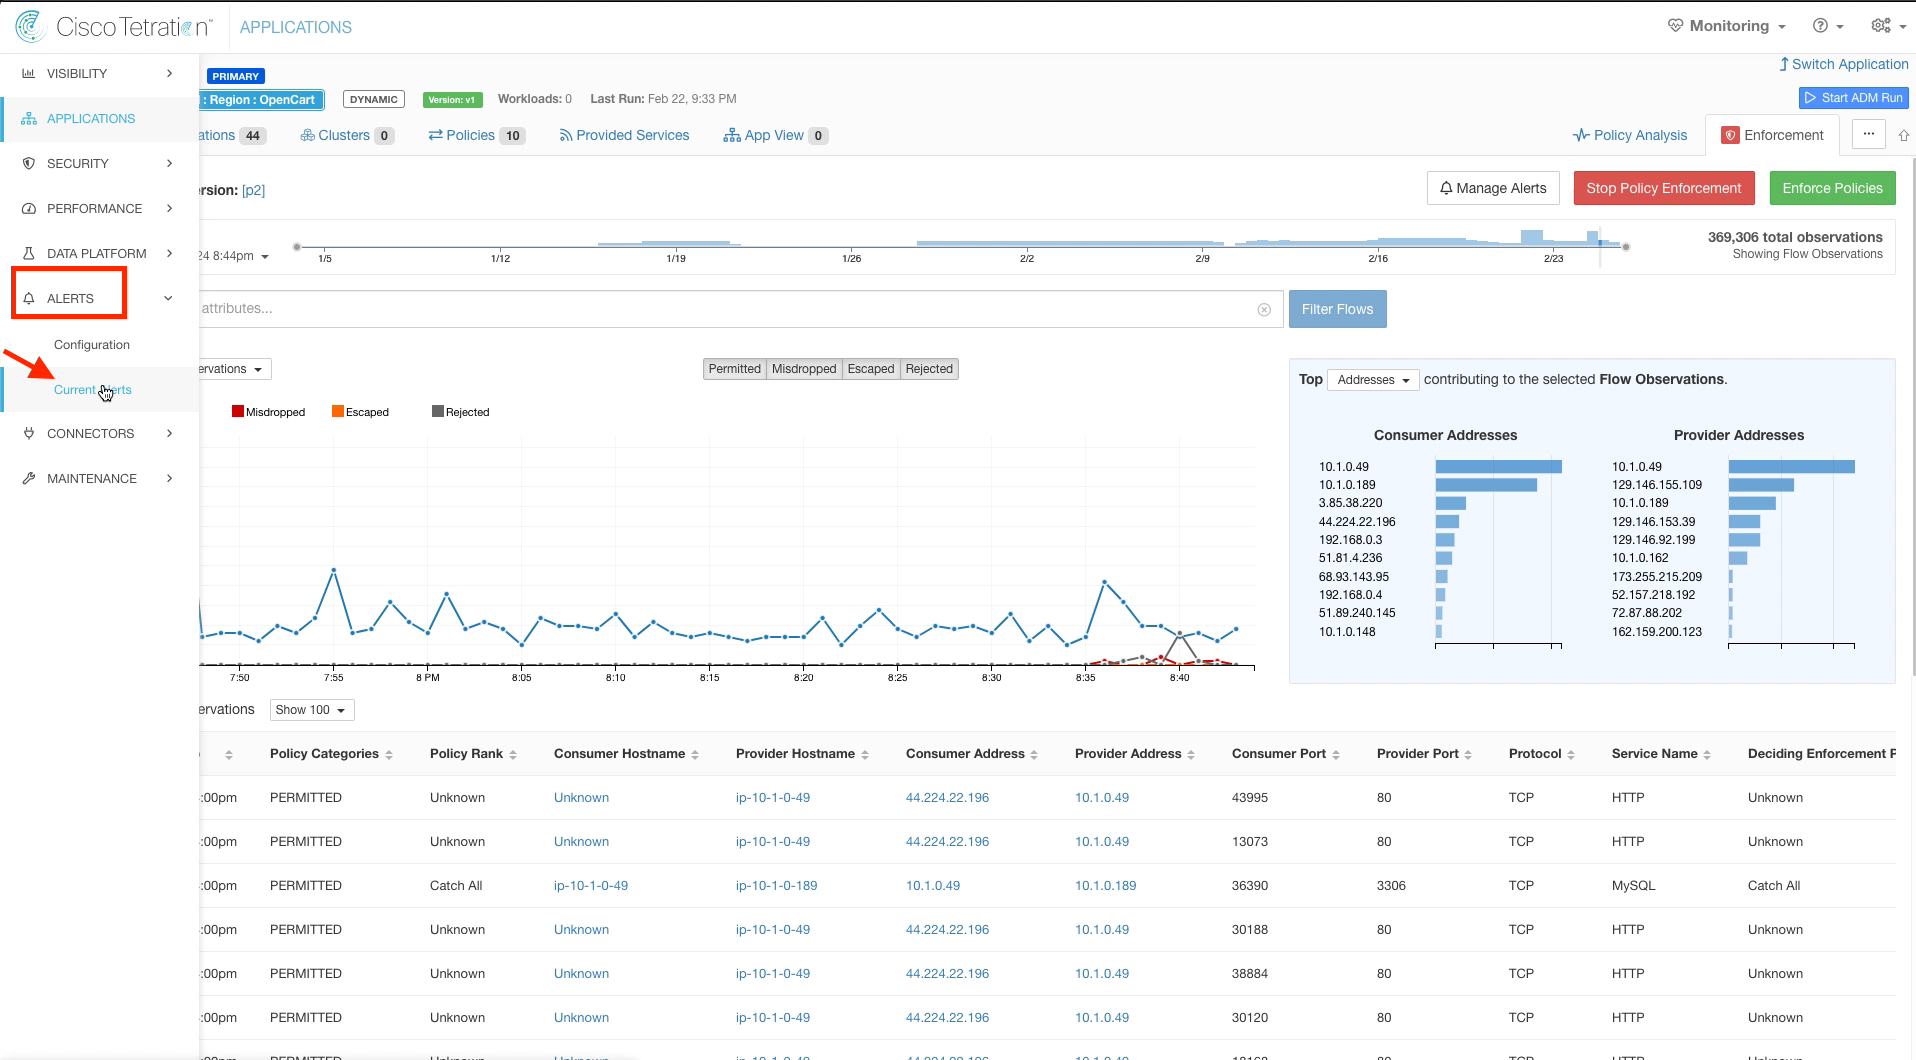
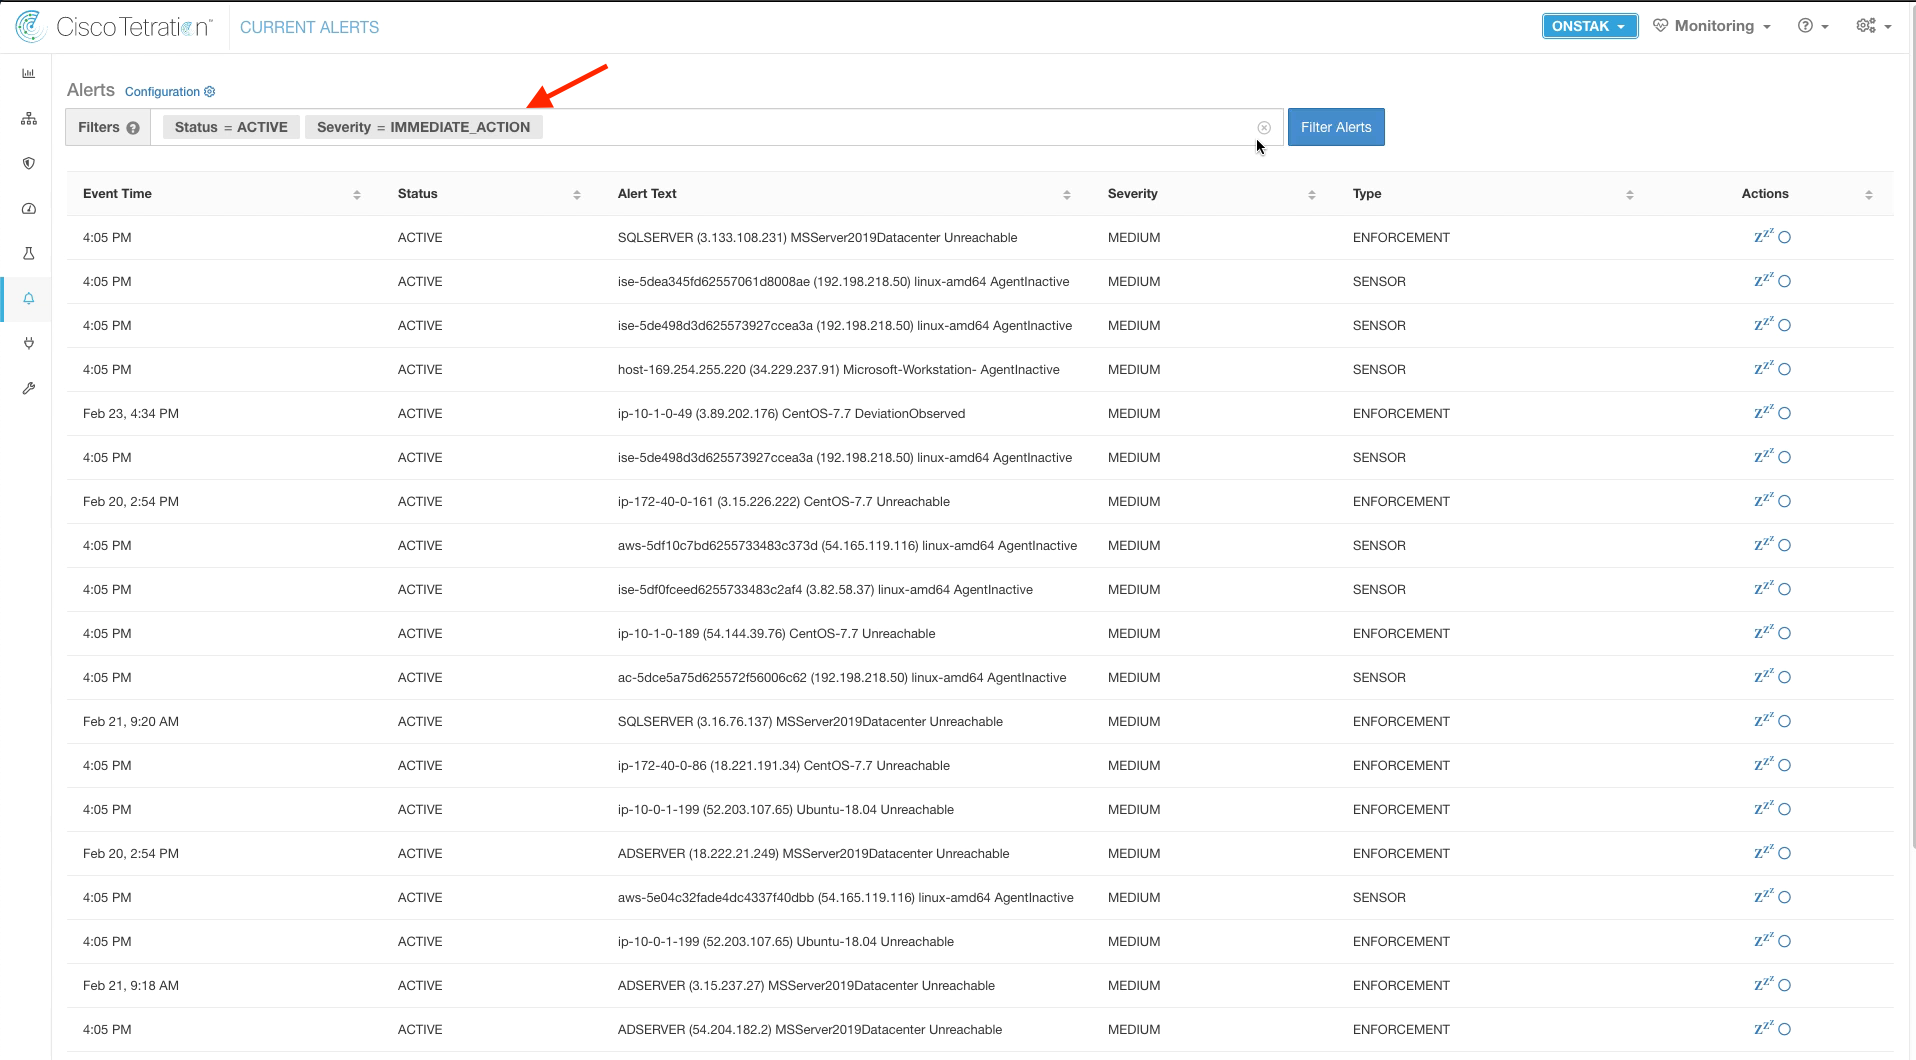
To view alerts within Tetration, click on Alerts and Current Alerts.
Here you can see all of the alerts that have been generated, and can filter the alerts by severity, alert type, alert text, or status.
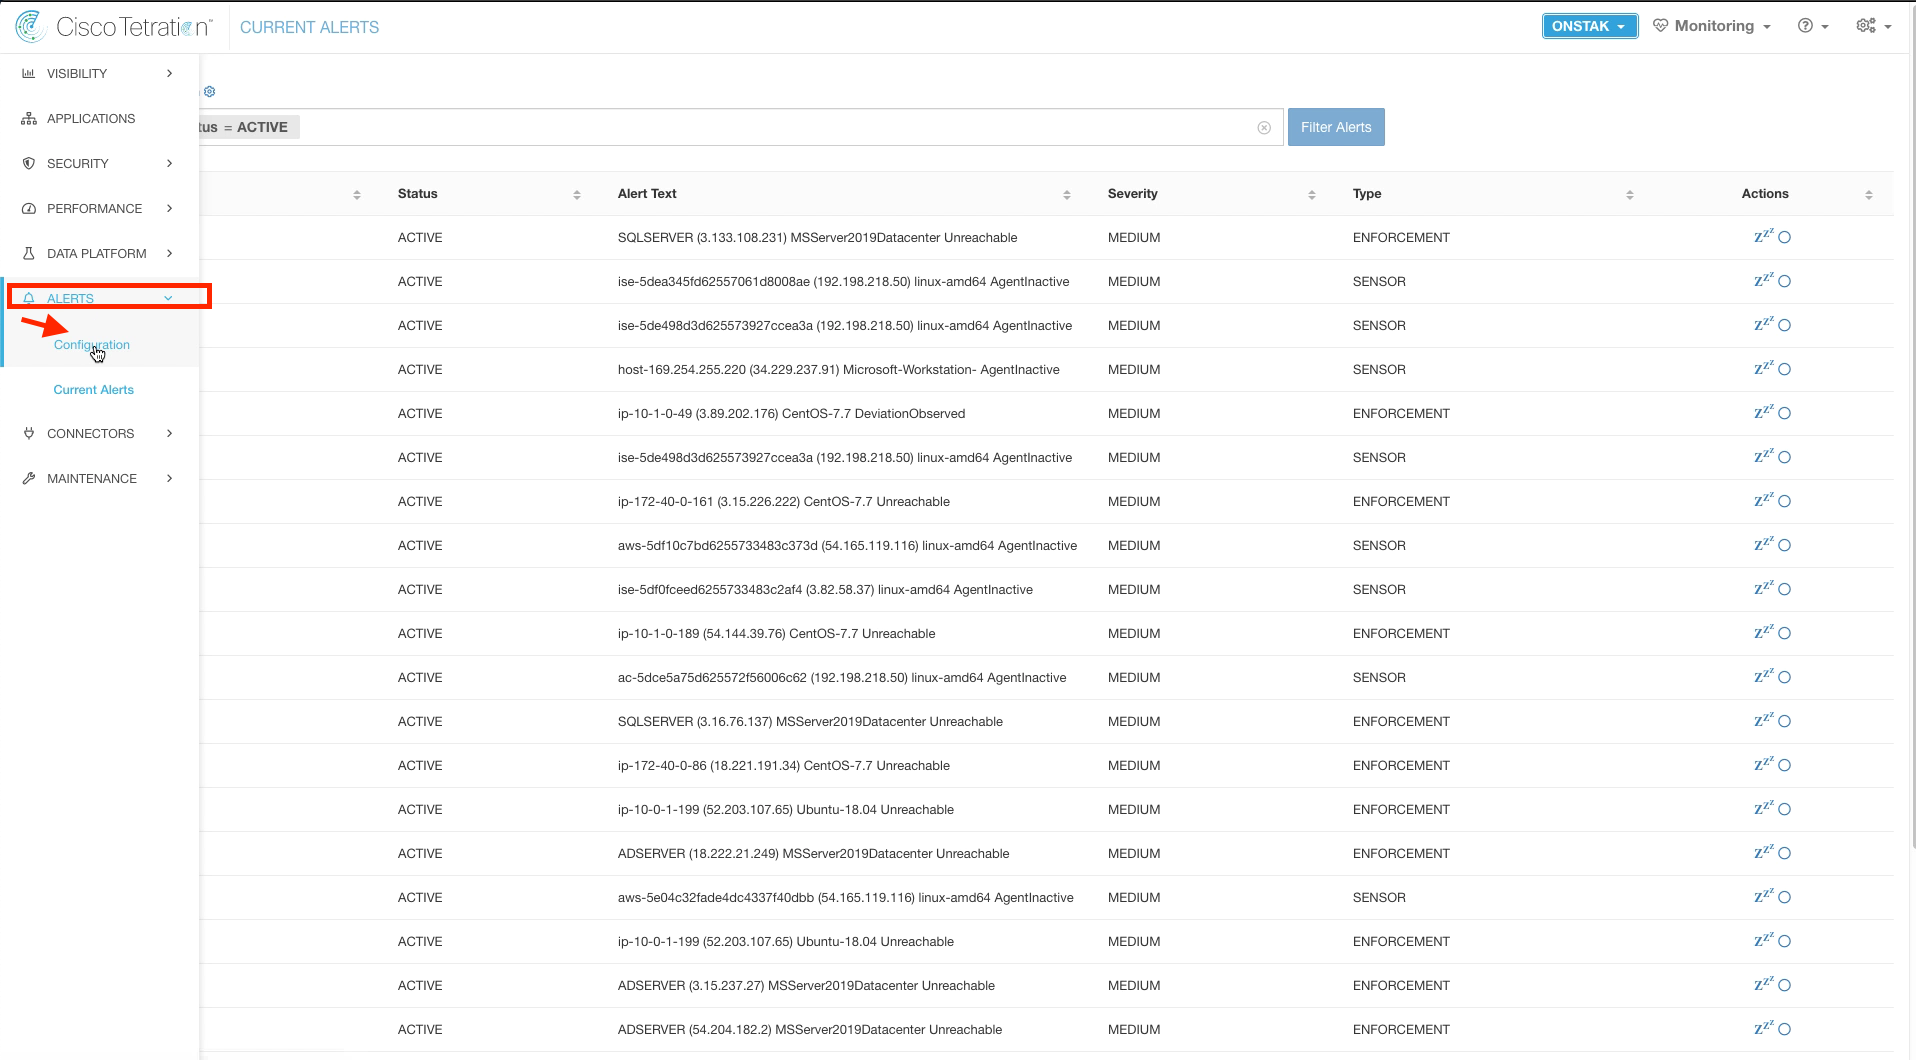
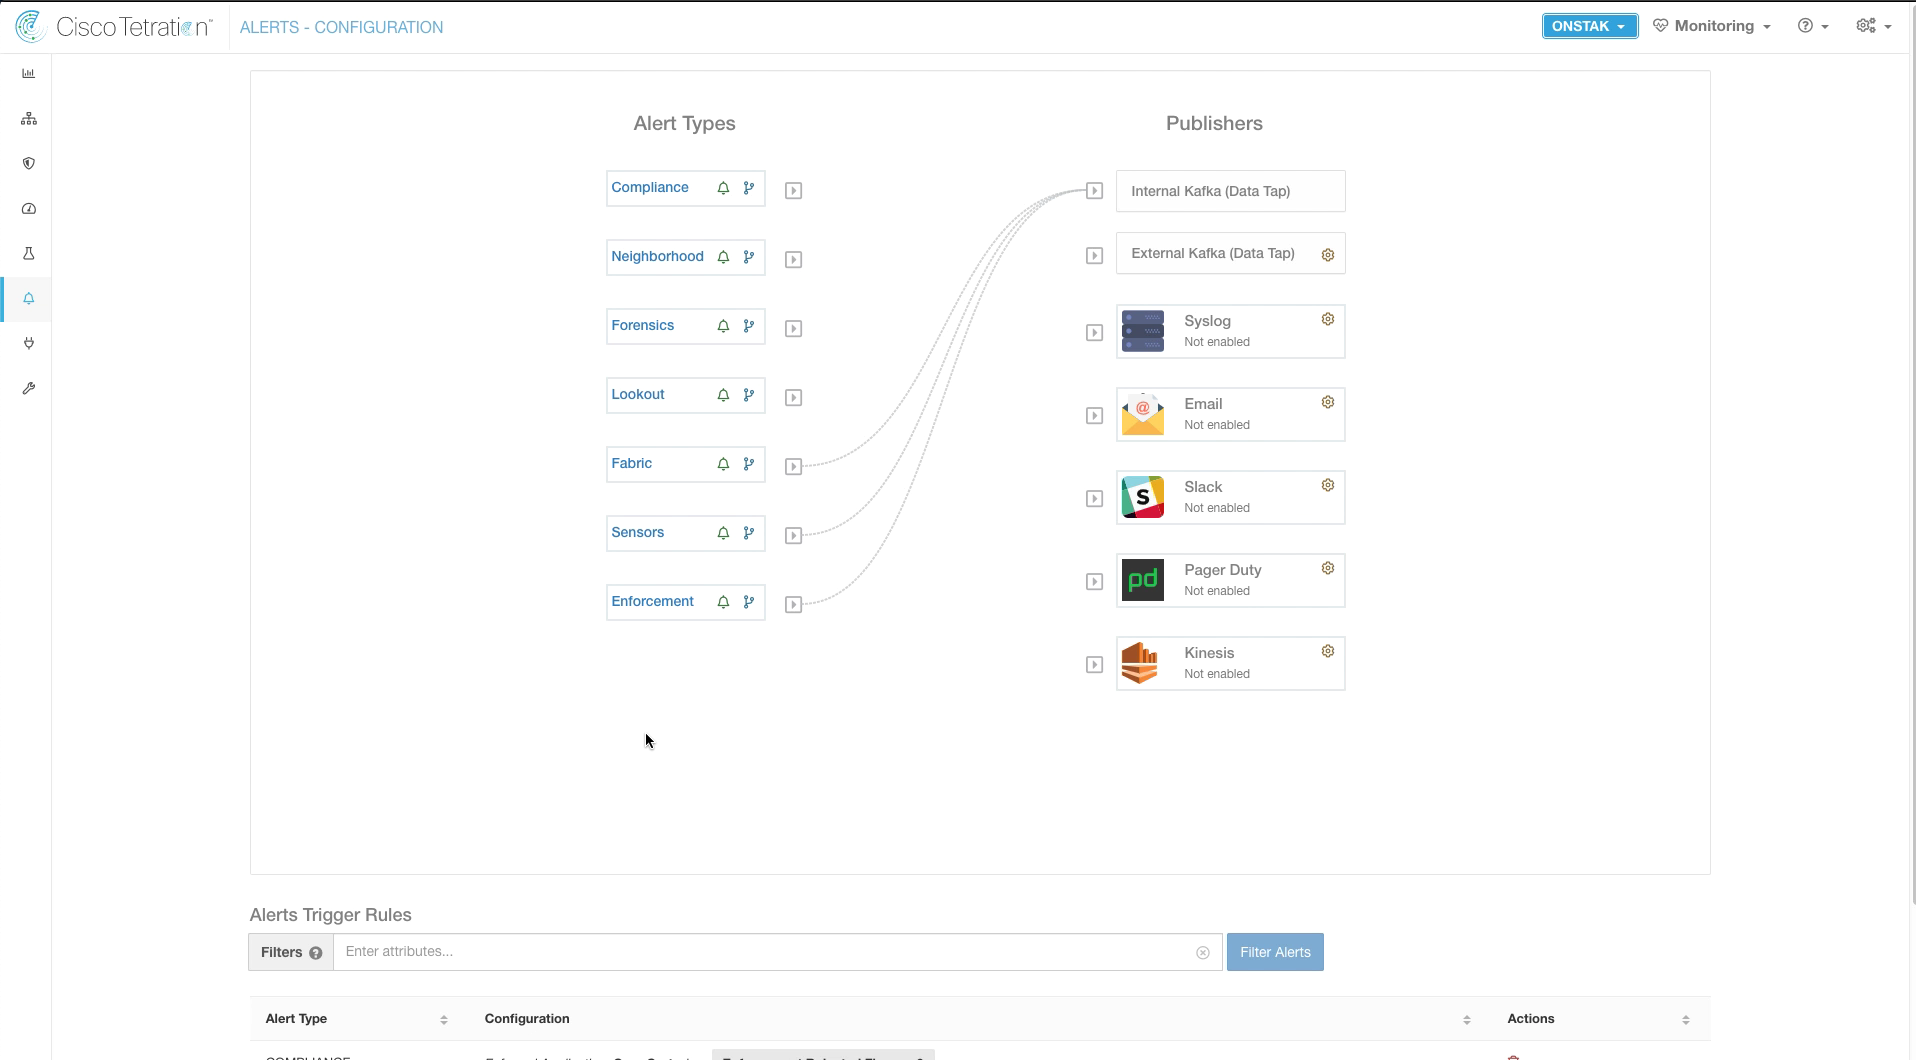
Click on Alerts and then Configuration.
Here you can configure alert destinations for each type of alert. The internal Kafka data tap is where the alerts we just viewed are stored. Alerts can also be sent to an External Kafka data tap, Syslog, E-Mail, Slack, Pager Duty or Kinesis.
YOU HAVE FINISHED THIS MODULE
| Return to Table of Contents | Go to Top of the Page | Continue to the Next Module |